How 3 makers, 2 devs and a princess came together to save kittens for a hackathon
The Story (Michael)
Just before Southcoast Summit 2021 got started, the organizers hosted the Automate Everything - SS2021 Hackathon where every solution revolves around Flic buttons. Wait, you don’t know what a Flic button is? It’s basically a wireless smart button that lets you control devices, apps and services. Push once, twice or hold the button and let each variant trigger a different action. There are multiple use cases in business but also in personal life in which Flic buttons make your life easier. Check out the Flic homepage to learn more.

Meet Petrol Push. A modern day organization that has a clear mission: Save kittens. There are hundreds of kittens all over Britain that get stuck in trees, get lost within the urban jungle or need help in any other kind of way. Luckily Petrol Push underholds a huge fleet of volunteers to rescue kittens every day.
the challenge
As you may know there is a petrol shortage happening right now and of course you wonder, how can Petrol Push keep up their noble mission? Flic Buttons and the Microsoft Power Platform gave them the ability to come up with a solutions to help all their volunteers in their day to day work.
the solution
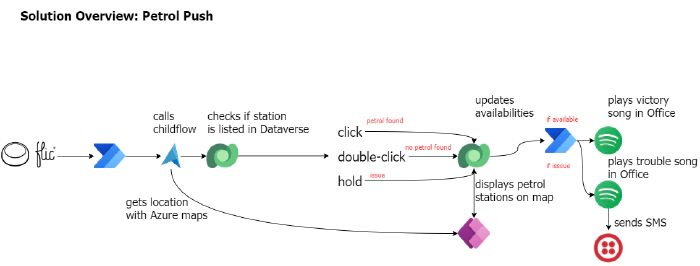
Every Petrol Push car got a Flic button installed and whenever Petrol Push volunteers pass a gas station, they can indicate with a push of a button, whether the gas station has fuel available or not. This information gets stored on a map so every Petrol Push employee knows where fuel is available and where it’s not. This way the volunteers can keep their focus on their mission. They don’t need to drive around searching for fuel or worry where to gas up. The community of volunteers takes care of that.
Petrol Push cares deeply about their volunteers so they don’t want to put them in danger in any way. That’s why this solution comes with a little extra. Petrol Push workers don’t have to check the map over and over again to see whether anything has changed. If one of the volunteers found a gas station where fuel is available, the button gets pushed and the fleet will get notified with a song. That way the drivers know when to check the map for updates.
Within these times it might happen that our drivers get in trouble themselves, run out of gas, have a flat tire or something else. Once again, Petrol Push cares about their volunteers deeply so the Flic button provides the opportunity to call other volunteers on the road for help. Once again with a song, so no other driver needs to check their phone. The position gets indicated on the map though, so that help can be arranged quickly. It’s only the supervisor that gets an additional text message in order to provide further information.
Note: you will probably know by know, but this use case exemplifies the ability to combine geographic location with notifications that are not based on text. In this way, we want to draw attention to how versatile Power Platform solutions are and we also want to think about the people who can only use devices in a limited way. Please use this use case to customize it to your needs. And always remember, only as a community we are strong, so let’s be inclusive
Now, let’s dive into details and see how this solution actually works
The Flic and the flow (Tomasz)
In a big picture, the flow was built to get information about location of a driver who triggered it, next to lookup details of the closest petrol station (by using Azure Maps API). Finally to save the station’s data together with status into database, so later it can be displayed with a proper color of a pin, inside the app. But in details, it’s much more interesting.

The flow can be triggered by any driver (1). Also, for any Flic event, but that will be described later. Next, bot looks up details of the button itself (2), to get its owner (3). This information will be later used to record data along with information about the driver.

Next the flow calls Azure Maps custom connector via a dedicated child flow (1), by passing latitude and longitude of a driver’s location. Coordinates are obtained using GPS from driver’s phone that is paired with Flic button. Obviously this should be done using the action directly within the parent flow, however for some *unknown reasons *we were facing an issue while saving process with the action inside, so we decided to move it into a child flow. Don’t judge :)
Data returned by the child flow, that represents details about the nearest petrol station is then parsed (2).
Finally bot using postal code is filtering existing stations’ data to get a match (3). This is done using ODATA expression:
woi_postalcode eq '@{first(body('Parse_JSON')?['results'])?['address']?['extendedPostalCode']}'.
Then it saves its row ID into variable (4). Naturally, if there’s no
station for the given postal code, variable will be empty. **We also
made an assumption**, that there can be one station for a given postal
code :)

Process now checks, if station’s row ID is empty (1) - if yes, it means it has to be created. Creation (2) of the record takes all the details returned from Azure Maps API, like full address, station name, lat and lon, information about driver who reported it and finally - the postal code. After that row ID of the created station is being saved into variable.

Now process moves to check what kind of action occurred on the Flic. There are 3 possible activities:
Single click - means that there’s petrol on the station,
Double click - means that there’s no petrol on the station,
Long press - means there’s an issue and driver requires assistance.
To check what action occurred, we are using switch action (1). For each branch process executes the same actions, just with different statuses. First, bot creates an entry in Activities table (2), to record latest status (to one from Petrol, No petrol, Issue) for the station together with driver details who reported it.
After that is done, it updates status (again to one from Petrol, No petrol, Issue) of the station record itself (3). Then it saves created activity record OData id into a variable. And finally it relates records (4) - petrol station together with the created activity record.

What is also worth to mention is that the whole process is built using the try-catch pattern. All actions that are executed in terms of the business logic are stored in the "Try" scope (1). If anything fails within the scope, it is caught by the "Catch" scope (2), that has it’s "Run after" settings configured to only be executed if previous actions fails, times out or is skipped.
Process in the “Catch” scope first filters (3) results of the “Try”
scope, using the expression result('Try') to leave only those entries
which contain information about errors:
@equals(createArray('Failed', 'TimedOut'), ''). Next for each such
record (4) it is adding information about the details to a string
variable. Finally, variable’s contents is sent to admin as a
notification (5) and the whole process ends up with "Failed" outcome.
Show me something beautiful - The canvas app (Carmen)
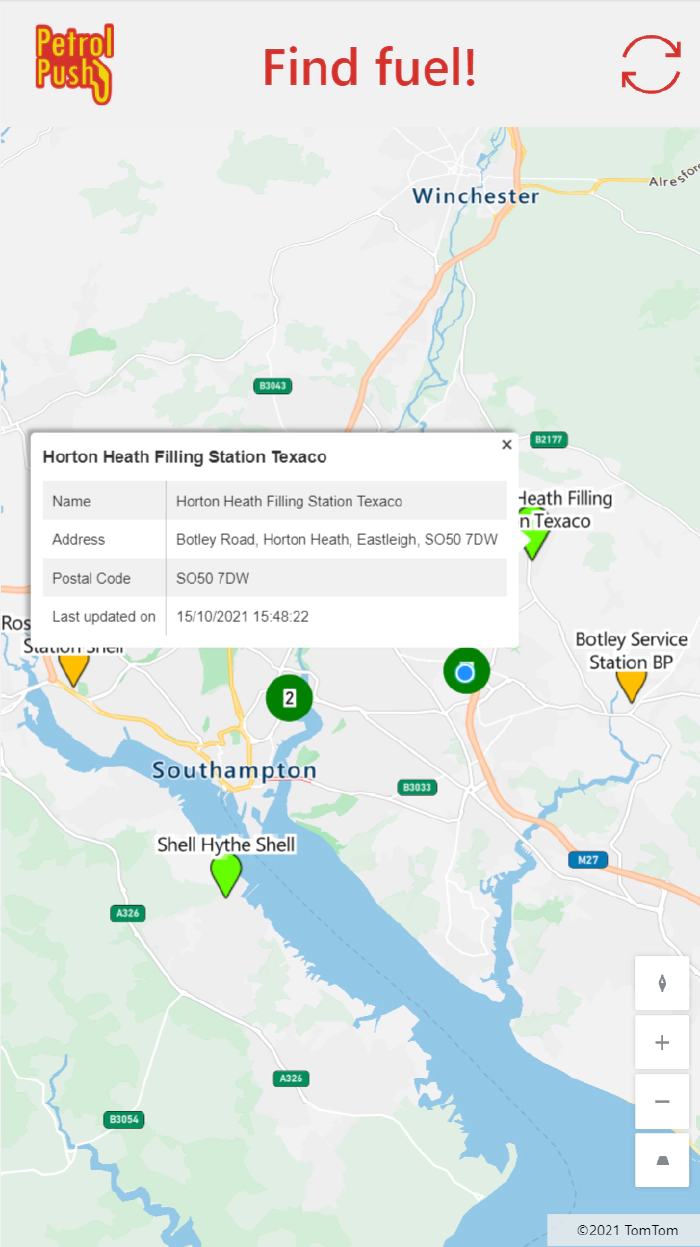
With the data stored in Dataverse, the canvas app can be created to display the available information and inform the people where they can find fuel. The canvas app consists of a header (with the company logo, name and refresh icon) and a map control.
We are using the built-in map control, which allows us to display the gas stations with their appropriate color, automatically center on the user’s current location and display additional information about each gas station when selecting the location pin.
To get the location pins on the map, we added the Dataverse table as a source in the Items property of the map control. We are currently not doing any filtering, but this could be added if needed. The latitude, longitude, labels and colors is each contained in a specific column within the data source. These are provided as values for the following properties (where the text between quotes is the name of the column in the Dataverse table):
- ItemsLabels =
"woi_name" - ItemsLatitudes =
"woi_latitude" - ItemsLongitudes=
"woi_longitude" - ItemsColors** **=
"woi_color"
The woi_colors columns is defined as a calculated column that is
influenced by the value of the Petrol Status column in the same table.
Petrol Status contains the last known status of fuel at the respective
station. The colors are defined as hex values with the following
mapping:
Last Known Status Color Color name Petrol “#66FF00” Light Green No petrol “#FF0000” Red Issue “#FFBF00” Amber
The color of the grouped pins is defined by the
PinColor** **property of the map control. It is set to Green,
which is a darker color than the green used for the stations with fuel.
When a pin is selected, the info card is shown. This is defined by
setting the InfoCards property of the map to
Microsoft.Map.InfoCards'.OnClick. The fields that are shown on the
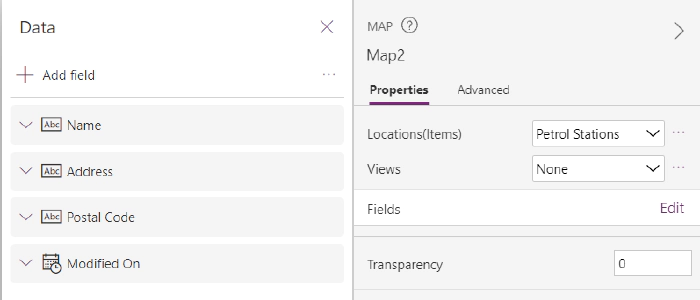
info card are defined by editing the **Fields** in the properties
pane of the map. Four fields are shown on the info card:
- Name
- Address
- Postal code
- Modified on (to know when the station’s status was last updated)
This can be seen on the below screenshot.

The resulting app shows a map with all identified gas stations and their last known status, indicated with the color of the pin. Selecting a specific gas station provides the user with more information on that station.

We need a real map - The custom connector to Azure Maps (Lee)
A key part of the solution is populating a list of petrol stations and their status based on presses of the Flic button. We initially looked to use the built-in Bing maps Power Automate connector and actions to find the current address when a Flic button was used. However, this would return the nearest address, which is not necessarily a petrol station (e.g. it could be a house on the opposite side of the street which is deemed nearer).
To work around this, we created an Azure Maps resource in Azure. Azure
Maps can return a list of addresses within a certain radius that fit a
particular “POI (point of interest) category” - in this case a petrol
station. Using the subscription-key (API key) from the Azure Maps
resource, we were able to create a custom connector in Power Automate
and query for the nearest petrol stations to the longitude and latitude
when the Flic button was pressed.
Bring me the vibes - The Spotify connector (Yannick)
We like to celebrate victories and help each other in times of need, and what better way than use music for this? We have a sound system in the office connected to Spotify so let’s use that to keep everyone updated on things that happen on the road!
A new Power Automate flow will trigger every time a new petrol station status is logged, excluding when no petrol was available. In the case someone found Petrol at a gas station, we get super excited for our colleague and play Fuel by Metallica in the office to have a small party. When someone gets in trouble, for whatever reason, we play Trouble by Coldplay (so we know we need to rush to rescue) and a text message is sent to the manager.
Integrating with Spotify isn’t too difficult (the API is well-documented) but requires the creation of a custom connector with following API actions:
Get a User’s Available Devices: fetch a list of all devices currently connected to the Spotify service
Start/Resume a User’s Playback: play a song on a specific device
When combining both, we can first fetch all connected devices and then filter them on the device id of our office sound system. If the device is connected, we can play the appropriate song for the occasion with the second API call.
And lastly, for the text message we’ll use Twilio. Luckily they have an existing connector within Power Automate so it’s only a matter of registering for a Twilio account, getting a number to send messages from and configuring the action in our flow.
The princess and the push (Luise)
Straight from the beginning of the hackathon, we took care of documenting our architecture decisions and how we would implement them. We set up a GitHub repository, invited everyone in the team so they could commit their files. We continued to document all major steps so that everyone could use this as a reference to explain our solution, although each member was only in charge of their workload. Getting all information and documenting while building ensured accuracy but also gave an opportunity to think through the app and reflect on decisions.
Documentation includes screenshots of the flows, explains the data model and environment variables. We also published the solution itself in this repository to give community the chance to play with our app.
What can we learn from this epic quest? (everybody)
As a group, we discussed the hackathon for quite a while even after it had ended, and we came up with, for us, four important lessons this experience has taught us.
1. Do one thing the right way, instead of a million things in a messy way
What helped us build this solution in a short timespan, was that each person of the team was responsible for a specific part of the solution. There was no context switching between the app studio and building the cloud flow for example. Instead, we made some agreements in the beginning of the day and let each other know verbally and in the documentation if anything needed to change. This allowed all of us to focus on their own part, resulting in finished pieces to the puzzle.
2. Take care of documentation
Since development was decentralized, it was important we could keep each other up to date on what we were doing. Therefore, we documented from the start. Since we were working against the clock, we had one person who constantly went around the table to see what each of us was working on and to make sure it was captured in the documentation. After the individual pieces were finished, this allowed us to piece them together more easily.
3. 1 + 1 = 3
Or in our case 6 x 1 = 10 (or something). Each of us has a different background, no two are the same. Because of this, we were able to share different perspectives and we were able to find the most efficient way to create the different pieces of the puzzle: e.g. Azure maps for station identification, canvas apps for a quick user interface and cloud flows for logic. Since we were not limited to one area of expertise, our solution combines the best of different worlds. In the process, we all learned from each other, either technical skills or an approach how to tackle something. And since we were all eager to learn from and share with each other, we had a lot of fun doing it.
4. We are all developers
Each of us is building or creating something on a daily basis, be that using no-code, low-code or code-first platforms and tools. During the hackathon, we realized that our commonalities are more important than our differences. We share a common problem-solving and solution-oriented approach. We can define logic and we do it in very similar terms (if - then - else, anyone?). We can conceptualize solutions and explain them to each other. And then each of us can find some way using their own tools to build that solution. This is what makes us developers, not the language or tool set we build things in, but the approach and mindset we share. All of us are developers, and you can be one too.
.jpg)