
From the contributor
How to use this sample
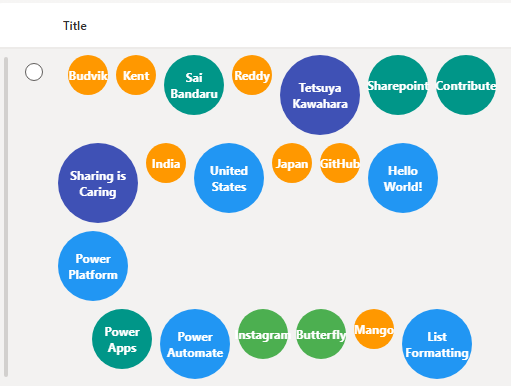
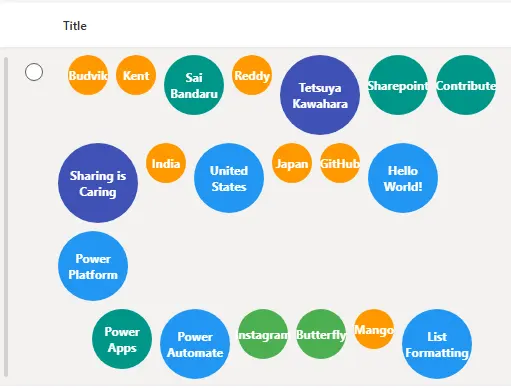
This sample demonstrates how to use SharePoint Column Formatting to create a dynamic bubble chart in a list view. The size and color of each bubble are automatically determined by the length of the text in its corresponding column, providing a quick visual representation of your data.
Summary
- The bubble size and color are dynamically generated.
- A wider range of sizes and colors is supported for a more vibrant appearance.
- The bubbles are arranged into a multi-line layout to prevent horizontal crowding.
- The text within each bubble is horizontally and vertically centered, even when it wraps to multiple lines.
View Requirements
Create a SharePoint list with the following columns:
| Column Name | Type |
|---|---|
| Title | Single Line of Text |
| LABEL1 | Single Line of Text |
| LABEL2 | Single Line of Text |
| LABEL3 | Single Line of Text |
| LABEL4 | Single Line of Text |
| LABEL5 | Single Line of Text |
| LABEL6 | Single Line of Text |
| LABEL7 | Single Line of Text |
| LABEL8 | Single Line of Text |
| LABEL9 | Single Line of Text |
| LABEL10 | Single Line of Text |
| LABEL11 | Single Line of Text |
| LABEL12 | Single Line of Text |
| LABEL13 | Single Line of Text |
| LABEL14 | Single Line of Text |
| LABEL15 | Single Line of Text |
| LABEL16 | Single Line of Text |
| LABEL17 | Single Line of Text |
| LABEL18 | Single Line of Text |
| LABEL19 | Single Line of Text |
| LABEL20 | Single Line of Text |
The formatting code will apply to the column containing the JSON and reference these other columns to create the complete visual.
How to Apply
- Open your SharePoint list.
- Click the column header you want to format → Column settings → Format this column.
- Switch to Advanced mode.
- Paste the JSON provided in this project into the formatting editor.
- Click Save. The column will render as a word cloud automatically.
How It Works
The bubble chart is created using a single JSON file that applies to a column in your SharePoint list. The key parts of the code are:
- Dynamic Sizing: The
widthandheightof each bubble are set using nestedifstatements that evaluate the length of the text in the correspondingLABELcolumn. This creates a range of sizes, from a small 30px bubble to a large 120px bubble. - Conditional Coloring: The
background-colorproperty is also controlled by the text length, with a different color assigned to each size range. - Multi-line Layout: The bubbles are grouped into separate
divelements to force them to wrap onto multiple lines, creating a clean, organized layout.
Sample
| Solution | Author(s) |
|---|---|
| generic-bubble-chart.json | Sai Bandaru |
Version History
| Version | Date | Comments |
|---|---|---|
| 1.0 | September 2, 2025 | Initial release |
Disclaimer
THIS CODE IS PROVIDED AS IS WITHOUT WARRANTY OF ANY KIND, EITHER EXPRESS OR IMPLIED, INCLUDING ANY IMPLIED WARRANTIES OF FITNESS FOR A PARTICULAR PURPOSE, MERCHANTABILITY, OR NON-INFRINGEMENT.
Additional Notes
- You can easily customize the bubble sizes, colors, and the number of rows by editing the JSON code.