
From the contributor
How to use this sample
Summary
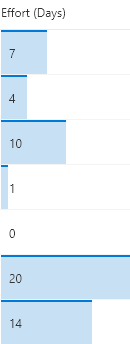
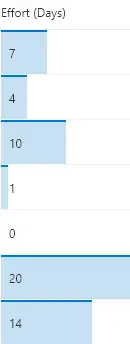
These formats apply background-color and border-top styles to create a data bar visualization of @currentField, which is a number field. These styles are applied using the special column formatting class sp-field-dataBars. The bars are sized differently for different values based on the way the width attribute of the main div is set.
Simple Data Bar (number-data-bar.json)
In this format, the data bar width is set to 100% when the value is greater than or equal to 20, and (@currentField * 5)% when the value is less than 20. This achieves a width of 5% for the data bar for values of 1, 10% for values of 2, and so on. To fit this example to your number column, you can adjust the boundary condition (20) to match the maximum anticipated value inside the field, and the multiplier (5) to specify how much the bar should grow depending on the value inside the field.
Percentage Data Bar (percent-data-bar.json)
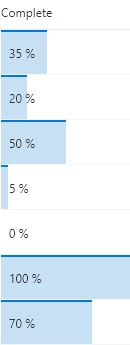
An additional format is included to illustrate how to apply the same visualization to a number column set to display as a percent. The data bar width is set to the @currentField's value directly and the display text adds the % sign as expected.
View requirements
- This format can be applied to a Number column
Sample
| Solution | Author(s) |
|---|---|
| number-data-bar.json | SharePoint Team |
| percent-data-bar.json | Chris Kent |
Version history
| Version | Date | Comments |
|---|---|---|
| 1.0 | November 2, 2017 | Initial release |
| 1.1 | May 27, 2018 | Fixed issue with 0 values and added percentage format |
| 1.2 | August 18, 2018 | Fixed issue with low value text wrapping and converted to excel-style expressions |
| 1.3 | May 17, 2019 | Added box-sizing:border-box to root style |
Disclaimer
THIS CODE IS PROVIDED AS IS WITHOUT WARRANTY OF ANY KIND, EITHER EXPRESS OR IMPLIED, INCLUDING ANY IMPLIED WARRANTIES OF FITNESS FOR A PARTICULAR PURPOSE, MERCHANTABILITY, OR NON-INFRINGEMENT.
Additional notes
This sample is also covered in the main documentation around Column Formatting.
A similar wizard is also included in the Column Formatter webpart that allows full customization.
Additional versions using Abstract Tree Syntax (AST) are also provided for environments where the Excel-style expressions are not supported.