
Back to view formats
View formattingSharePoint Online

Weekly Heatmap

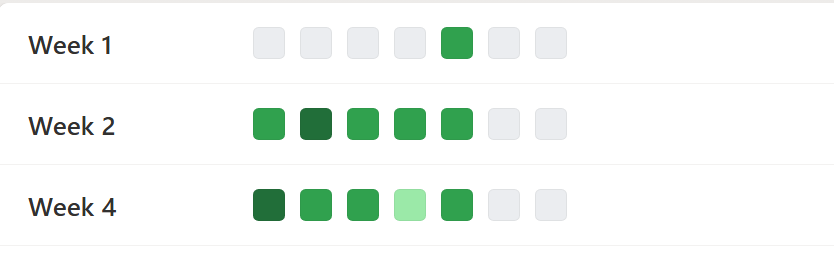
This sample uses SharePoint List Formatting to display weekly data as a heatmap calendar view.

Weekly Heatmap formatting preview
Sample preview · View original image

Copy. Apply. Make it yours.

Get this format

1 definition

Review the requirements below, then paste this JSON into the matching formatting panel. Show me where.

Use your list's internal column names and replace any tenant-specific URLs or flow IDs. Formatting is presentation, not a way to secure data.

View formatting
Download JSON
{
  "$schema": "https://developer.microsoft.com/json-schemas/sp/v2/row-formatting.schema.json",
  "hideColumnHeader": true,
  "hideSelection": true,
  "rowFormatter": {
    "elmType": "div",
    "style": {
      "display": "flex",
      "align-items": "center",
      "padding": "12px 16px",
      "border-bottom": "1px solid #f3f2f1",
      "background-color": "#ffffff"
    },
    "children": [
      {
        "elmType": "div",
        "style": {
          "min-width": "100px",
          "margin-right": "20px",
          "font-weight": "600",
          "font-size": "14px",
          "color": "#323130"
        },
        "txtContent": "[$Title]"
      },
      {
        "elmType": "div",
        "style": {
          "display": "flex",
          "gap": "8px",
          "align-items": "center"
        },
        "children": [
          {
            "elmType": "div",
            "style": {
              "width": "16px",
              "height": "16px",
              "background-color": "=if(Number([$Monday]) <= 0, '#ebedf0', if(Number([$Monday]) <= 3, '#9be9a8', if(Number([$Monday]) <= 6, '#40c463', if(Number([$Monday]) <= 11, '#30a14e', '#216e39'))))",
              "border-radius": "3px",
              "cursor": "pointer",
              "border": "1px solid rgba(27,31,35,0.06)"
            },
            "attributes": {
              "title": "='Monday: ' + [$Monday] + ' contributions'"
            }
          },
          {
            "elmType": "div",
            "style": {
              "width": "16px",
              "height": "16px",
              "background-color": "=if(Number([$Tuesday]) <= 0, '#ebedf0', if(Number([$Tuesday]) <= 3, '#9be9a8', if(Number([$Tuesday]) <= 6, '#40c463', if(Number([$Tuesday]) <= 11, '#30a14e', '#216e39'))))",
              "border-radius": "3px",
              "cursor": "pointer",
              "border": "1px solid rgba(27,31,35,0.06)"
            },
            "attributes": {
              "title": "='Tuesday: ' + [$Tuesday] + ' contributions'"
            }
          },
          {
            "elmType": "div",
            "style": {
              "width": "16px",
              "height": "16px",
              "background-color": "=if(Number([$Wednesday]) <= 0, '#ebedf0', if(Number([$Wednesday]) <= 3, '#9be9a8', if(Number([$Wednesday]) <= 6, '#40c463', if(Number([$Wednesday]) <= 11, '#30a14e', '#216e39'))))",
              "border-radius": "3px",
              "cursor": "pointer",
              "border": "1px solid rgba(27,31,35,0.06)"
            },
            "attributes": {
              "title": "='Wednesday: ' + [$Wednesday] + ' contributions'"
            }
          },
          {
            "elmType": "div",
            "style": {
              "width": "16px",
              "height": "16px",
              "background-color": "=if(Number([$Thursday]) <= 0, '#ebedf0', if(Number([$Thursday]) <= 3, '#9be9a8', if(Number([$Thursday]) <= 6, '#40c463', if(Number([$Thursday]) <= 11, '#30a14e', '#216e39'))))",
              "border-radius": "3px",
              "cursor": "pointer",
              "border": "1px solid rgba(27,31,35,0.06)"
            },
            "attributes": {
              "title": "='Thursday: ' + [$Thursday] + ' contributions'"
            }
          },
          {
            "elmType": "div",
            "style": {
              "width": "16px",
              "height": "16px",
              "background-color": "=if(Number([$Friday]) <= 0, '#ebedf0', if(Number([$Friday]) <= 3, '#9be9a8', if(Number([$Friday]) <= 6, '#40c463', if(Number([$Friday]) <= 11, '#30a14e', '#216e39'))))",
              "border-radius": "3px",
              "cursor": "pointer",
              "border": "1px solid rgba(27,31,35,0.06)"
            },
            "attributes": {
              "title": "='Friday: ' + [$Friday] + ' contributions'"
            }
          },
          {
            "elmType": "div",
            "style": {
              "width": "16px",
              "height": "16px",
              "background-color": "=if(Number([$Saturday]) <= 0, '#ebedf0', if(Number([$Saturday]) <= 3, '#9be9a8', if(Number([$Saturday]) <= 6, '#40c463', if(Number([$Saturday]) <= 11, '#30a14e', '#216e39'))))",
              "border-radius": "3px",
              "cursor": "pointer",
              "border": "1px solid rgba(27,31,35,0.06)"
            },
            "attributes": {
              "title": "='Saturday: ' + [$Saturday] + ' contributions'"
            }
          },
          {
            "elmType": "div",
            "style": {
              "width": "16px",
              "height": "16px",
              "background-color": "=if(Number([$Sunday]) <= 0, '#ebedf0', if(Number([$Sunday]) <= 3, '#9be9a8', if(Number([$Sunday]) <= 6, '#40c463', if(Number([$Sunday]) <= 11, '#30a14e', '#216e39'))))",
              "border-radius": "3px",
              "cursor": "pointer",
              "border": "1px solid rgba(27,31,35,0.06)"
            },
            "attributes": {
              "title": "='Sunday: ' + [$Sunday] + ' contributions'"
            }
          }
        ]
      }
    ]
  }
}

From the contributor

How to use this sample

This sample uses SharePoint List Formatting to display weekly data as a heatmap calendar view.
Each row represents a week, and daily values are visualized with conditional background colors, making it easy to spot trends and high/low activity days.
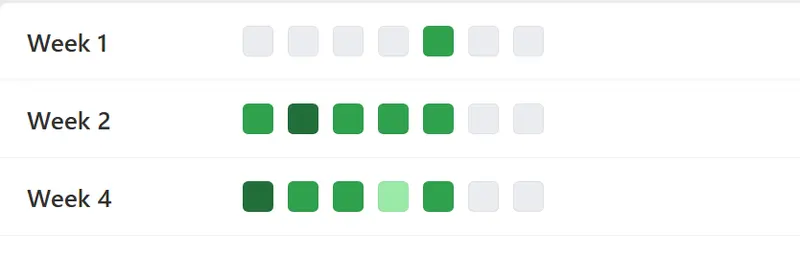
screenshot of the sample

Summary

  • Each day (Monday–Sunday) is displayed in a horizontal weekly row.
  • Cell background colors are based on the numeric values (higher values = darker shade).
  • Values 0 or less are shown in gray, while values greater than 11 are displayed with the darkest green.
  • The WeekStartDate column ensures proper ordering of weekly records.
  • The Team column can be used to filter heatmaps by department.

View Requirements

Create a list with the following columns:

Internal Name Type
Title Single line of text
WeekStartDate Date and Time (Date only)
Monday Number
Tuesday Number
Wednesday Number
Thursday Number
Friday Number
Saturday Number
Sunday Number
Team Choice (e.g., Development, QA, Design, etc.)

Sample Data

Title WeekStartDate Monday Tuesday Wednesday Thursday Friday Saturday Sunday Team
Week 1 2025-08-01T04:00:00Z 0 0 0 0 10 0 0 Development
Week 2 2025-08-04T04:00:00Z 10 20 8 9 7 0 0 Development
Week 4 2025-08-11T04:00:00Z 12 11 8 3 10 0 0 Development

Sample

Solution Author(s)
weekly-heatmap.json Sai Bandaru

Version history

Version Date Comments
1.0 August 19, 2025 Initial release

Disclaimer

THIS CODE IS PROVIDED AS IS WITHOUT WARRANTY OF ANY KIND, EITHER EXPRESS OR IMPLIED, INCLUDING ANY IMPLIED WARRANTIES OF FITNESS FOR A PARTICULAR PURPOSE, MERCHANTABILITY, OR NON-INFRINGEMENT.


Additional Notes

  • You can adjust the color scale thresholds in the JSON to match your data distribution.
  • Supports both light and dark SharePoint themes.
  • Works best in List view with WeekStartDate sorted ascending.