
A reusable Power Platform snippet
Chart (Topic)
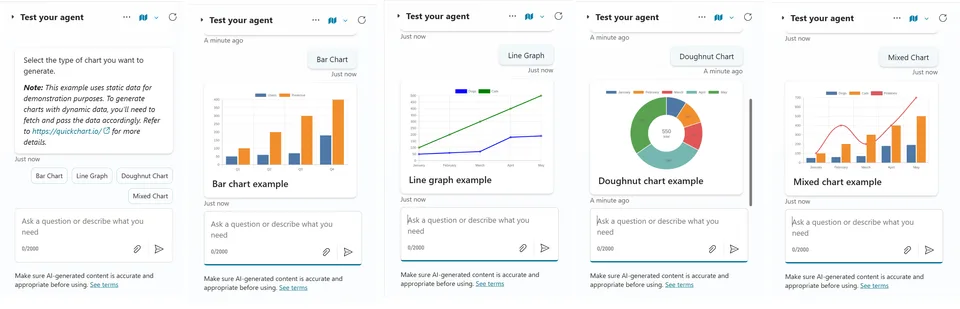
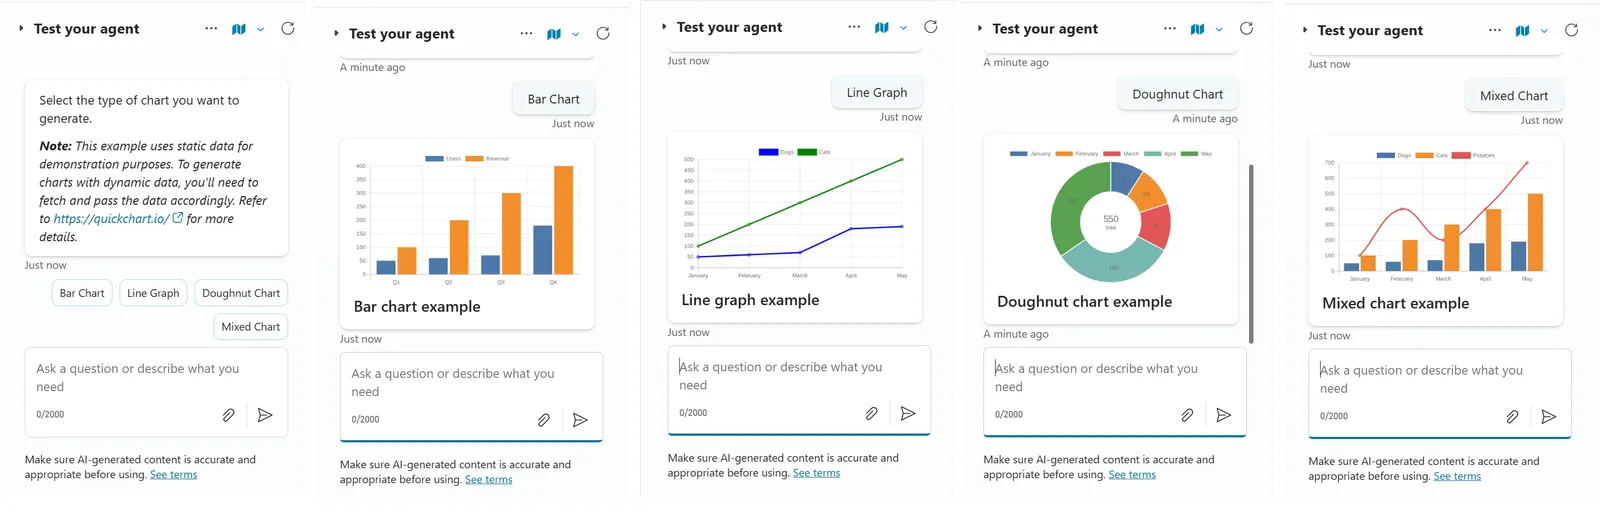
This snippet demonstrates how to render charts in Copilot Studio agents using an HTTP based chart rendering API.
 Copilot Studio
- Last updated
- Mar 16, 2025
- Category
- Community snippet
From idea to implementation
Make it your own.
Check this snippet's prerequisites, permissions, and licensing before using it. The documentation below comes directly from the snippet README.
This snippet demonstrates how to render charts in Copilot Studio agents using an HTTP based chart rendering API.
[!IMPORTANT] This example uses an open source QuickChart HTTP based chart rendering API. If you don't prefer to use a third-party service, you can implement your own API. The custom API should accept chart related data via an HTTP URL and return the chart as an image..
Authors
| Snippet | Author(s) |
|---|---|
| Chart Topic | Shrutika Patil (@Shrutika Patil ) |
Minimal path to awesome
- Open a copilot in Copilot Studio
- Select Topics
- Select + Add a topic
- Select Create from blank
- Select the ... in the upper right corner and select Open code editor
- Click inside the code editor and CTL + A for Windows or Command-A for Mac to select all rows.
- Paste the contents of the YAML-file inside the code editor.
- Enter a Name for your Topic.
- Select Save
Disclaimer
THIS CODE IS PROVIDED AS IS WITHOUT WARRANTY OF ANY KIND, EITHER EXPRESS OR IMPLIED, INCLUDING ANY IMPLIED WARRANTIES OF FITNESS FOR A PARTICULAR PURPOSE, MERCHANTABILITY, OR NON-INFRINGEMENT.