
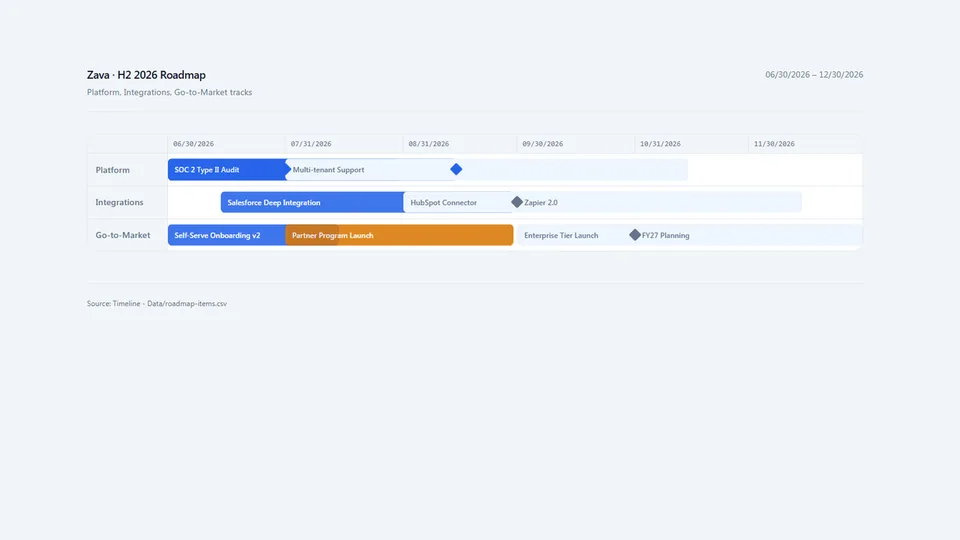
Generates a complete, self-contained HTML visualization by interviewing the user or parsing their data, constructing and validating a JSON document, then rendering it into a sandbox-safe HTML file. Automatically chooses between two layouts: horizontal swimlane roadmap (for phase-range data) or vertical milestone timeline (for point-in-time events).
All layout positions are pre-computed as percentages and embedded as inline styles — no JavaScript is required for positioning. Includes a today-line overlay, status-colored phase blocks, and milestone diamonds. Four visual palette options. No external dependencies — output runs inside a SharePoint sandboxed iframe.
Generates a polished, self-contained HTML roadmap or milestone timeline from any project data — SharePoint lists, pasted tables, or a verbal description. Automatically chooses between a horizontal swimlane roadmap (for phase-range data) or a vertical milestone list (for point-in-time events).
What you get
- A complete, self-contained HTML visualization in one of two layouts: horizontal swimlane roadmap or vertical milestone timeline
- Percentage-based layout pre-computed directly in the HTML — no JavaScript required for positioning
- A today-line overlay (roadmap mode), status-colored phase blocks, and milestone diamonds
- Four visual palette options; defaults to slate for roadmaps and warm paper for milestone lists
When to use
Ask Copilot:
- "build a roadmap" / "create a timeline" / "show the project phases"
- "migration plan" / "release schedule" / "onboarding sequence"
- "show milestones" / "run of show" / "gantt chart"
SharePoint Skill
| Solution | Author(s) |
|---|---|
| roadmap-timeline | Zach Rosenfield | GitHub | LinkedIn |
Version history
| Version | Date | Comments |
|---|---|---|
| 1.0 | May 2026 | Initial Release |
Disclaimer
THIS CODE IS PROVIDED AS IS WITHOUT WARRANTY OF ANY KIND, EITHER EXPRESS OR IMPLIED, INCLUDING ANY IMPLIED WARRANTIES OF FITNESS FOR A PARTICULAR PURPOSE, MERCHANTABILITY, OR NON-INFRINGEMENT.
Package
Ready to install
The ZIP contains only the upload-ready inner skill folder.
View SKILL.md
---
name: roadmap-timeline
description: >
  Generates a polished, self-contained HTML roadmap or milestone timeline from any project
  data — SharePoint lists, pasted tables, or a verbal description. Use when asked to build
  a project roadmap, product roadmap, migration timeline, release plan, onboarding sequence,
  run-of-show, phase plan, or any visual schedule showing items over time. Interviews the
  user if data is incomplete, constructs a validated JSON document, then renders it into a
  single sandbox-safe HTML file. Chooses between two layouts automatically: horizontal
  roadmap with swimlanes (for phase-range data) or vertical milestone list (for
  point-in-time events). No external dependencies — output runs inside a SharePoint
  sandboxed iframe.
metadata:
  author: zrosenfield
---

# Roadmap Timeline

Generates a complete, self-contained HTML visualization by (1) interviewing the user or parsing their data, (2) constructing and validating a JSON document, then (3) rendering that JSON into HTML using `assets/roadmap-timeline-template.html`. The JSON is the authoritative source of truth; the HTML is fully determined by it.

---

## Step 1: Determine the Data Source

Check what the user has already provided before asking anything:

- **SharePoint lists**: Call `list_items` on the relevant lists. Read all needed columns before proceeding.
- **CSV or table pasted in chat**: Parse all rows. Do not ask for data you already have.
- **Verbal description only**: Proceed to Step 2.

---

## Step 2: Interview the User

If the data or intent is not fully clear, ask these questions in a single message — not one at a time:

1. **Topic**: What is this timeline about? (e.g., "Q3 product launch plan," "cloud migration phases," "new employee onboarding")
2. **Date range**: What is the overall span? (start and end dates for the full view)
3. **Swimlanes / tracks**: Are there parallel workstreams or teams? (e.g., "Engineering," "Product," "Marketing") If yes → roadmap mode. If items are point-in-time events only → milestones mode.
4. **Items**: List the phases or milestones with their dates, owners, and status.
5. **Palette**: Warm paper (cream/terra-cotta), deep ink (dark/gold), clean white (white/green), or slate (gray/blue)? Default to slate for roadmaps, warm-paper for milestone lists.
6. **Footer**: Any footer text (date, project name, audience)?

Confirm your understanding before building the JSON.

---

## Step 3: Choose the Rendering Mode

**Roadmap mode** — use when items have start and end date ranges (duration blocks):
- Items span days, weeks, or months
- Multiple parallel workstreams exist (or a single flat track is still cleaner as roadmap)
- The user mentions "phases," "sprints," "quarters," "swimlanes," or "gantt"

**Milestones mode** — use when items are point-in-time events:
- Items have a single date (no duration)
- The user mentions "milestones," "deliverables," "checkpoints," "onboarding steps," or "run of show"

When data is mixed (some ranges, some points), use roadmap mode and mark point-in-time items as `"milestone": true`.

---

## Step 4: Build and Validate the JSON Document

Construct the JSON object. Full schema:

### `report` object

| Field | Required | Description |
|---|---|---|
| `title` | yes | Report title, shown in header strip |
| `subtitle` | no | Subtitle or context line |
| `date_range_start` | roadmap only | ISO date string, e.g. `"2026-01-01"` |
| `date_range_end` | roadmap only | ISO date string, e.g. `"2026-06-30"` |
| `palette` | yes | `warm-paper`, `deep-ink`, `clean-white`, or `slate` |
| `footer` | no | Footer text |

### `mode` string

`"roadmap"` or `"milestones"`.

### `swimlanes` array (roadmap mode only)

| Field | Required | Description |
|---|---|---|
| `id` | yes | Short identifier, e.g. `"eng"` |
| `label` | yes | Display name, e.g. `"Engineering"` |

### `items` array

| Field | Required | Description |
|---|---|---|
| `id` | yes | Unique short identifier, e.g. `"item-1"` |
| `title` | yes | Display label for the block or card |
| `swimlane_id` | roadmap only | References a swimlane `id` |
| `start` | yes | ISO date string |
| `end` | roadmap mode | ISO date string (omit for pure milestones mode) |
| `status` | yes | `on-track`, `at-risk`, `delayed`, `complete`, or `planned` |
| `milestone` | no | `true` if this is a point-in-time event within a roadmap |
| `owner` | no | Text name of the owner (no Person column — plain text only) |
| `description` | no | Additional detail shown in tooltip (roadmap) or card body (milestones) |
| `dependencies` | no | Array of `id` strings; rendered as a text note, not as arrows |

### Date-to-Percentage Computation (roadmap mode)

The skill pre-computes all layout positions as percentages. No JavaScript is required for positioning — all values are embedded in the HTML as inline styles.

| Value | Formula |
|---|---|
| `total_days` | Days between `date_range_end` and `date_range_start` (inclusive span) |
| `item_left_pct` | `((item_start − date_range_start) / total_days) × 100` |
| `item_width_pct` | `((item_end − item_start) / total_days) × 100` |
| `today_left_pct` | `((today − date_range_start) / total_days) × 100` |

Rules:
- Clamp all results to 0.00–100.00
- Round to 2 decimal places
- Minimum rendered width for any block: 1.50% (so very short items are always visible)
- If `item_end` equals `item_start`, treat the item as a milestone (diamond) regardless of the `milestone` flag

Today's date is known from the system context. If today falls outside the date range, omit the today-line entirely.

### Validation Checklist

Run every check before rendering. Fix any failure before proceeding.

**Document level:**
- [ ] `mode` is `"roadmap"` or `"milestones"`
- [ ] `report.palette` is one of: `warm-paper`, `deep-ink`, `clean-white`, `slate`
- [ ] `items` array has at least one entry
- [ ] Roadmap mode: `report.date_range_start` and `report.date_range_end` are present and parseable as ISO dates
- [ ] Roadmap mode: `date_range_end` is after `date_range_start`
- [ ] Roadmap mode: `swimlanes` array has at least one entry

**Per item:**
- [ ] `id` is unique within the `items` array
- [ ] `title` is present and non-empty
- [ ] `start` is a valid ISO date string
- [ ] Roadmap mode: `end` is present and not before `start`
- [ ] `status` is one of: `on-track`, `at-risk`, `delayed`, `complete`, `planned`
- [ ] Roadmap mode: `swimlane_id` references a valid swimlane `id`
- [ ] `dependencies` entries (if present) each reference a valid item `id`
- [ ] `item_left_pct + item_width_pct` does not exceed 101 (floating-point tolerance)

**Computation check:**
- [ ] All percentage values computed and clamped to 0–100
- [ ] Milestone items have `item_width_pct = 0` (rendered as diamonds, not blocks)
- [ ] Today-line computed only when today is within the date range

---

## Step 5: Render the HTML

Read `assets/roadmap-timeline-template.html`.

For both modes:
1. Replace `{{REPORT_TITLE}}` in `<title>` with a concise page title.
2. Replace `{{PALETTE_CLASS}}` on `<body>` with `palette-` + palette name.
3. Replace `{{HEADER}}` with the `.rpt-header` strip (title, subtitle, date range).
4. Replace `{{CONTENT}}` with the full rendered visualization (roadmap or milestones).
5. Replace `{{FOOTER}}` with footer text (or empty string).
6. Replace `{{INLINE_SCRIPT}}` with any enhancement JS (tooltip hover, palette switcher if needed).

See `references/components.md` for the exact HTML structure of each mode.

### Roadmap Mode Rendering

Generate the month-marker ruler, then one `.swimlane` row per swimlane entry. Within each row:
- Render phase blocks as `<div class="phase-block status-{status}">` with inline `left` and `width` percentage styles.
- Render milestone items as `<div class="milestone-diamond status-{status}">` with inline `left` percentage style.
- Render the today-line as `<div class="today-line">` with inline `left` percentage style (omit if today is out of range).

### Milestones Mode Rendering

Group items by phase (if phases are named in `description` or a `group` field is provided). For each item render a `.milestone-card` with a date badge, status dot, title, owner, and description.

---

## Hard Constraints

- No external URLs, CDN links, or web fonts in the output HTML.
- No `<script src>` tags. All JavaScript must be inline.
- All data values must be pre-rendered into the HTML — the page must be fully correct with JavaScript disabled. JS adds tooltips and animations but must never be required for correctness.
- Do not generate Python, PowerShell, or any other scripts — output is always the HTML file.
- Do not render until the validation checklist passes.
- Owner fields must be plain text — no Person column types.
References
- agentskills.io specification
The specification that SharePoint AI skills follow for installation and discovery.
Discuss this skill
Ask a question, share how you used it, or suggest an improvement with the community.
Open GitHub Discussions