
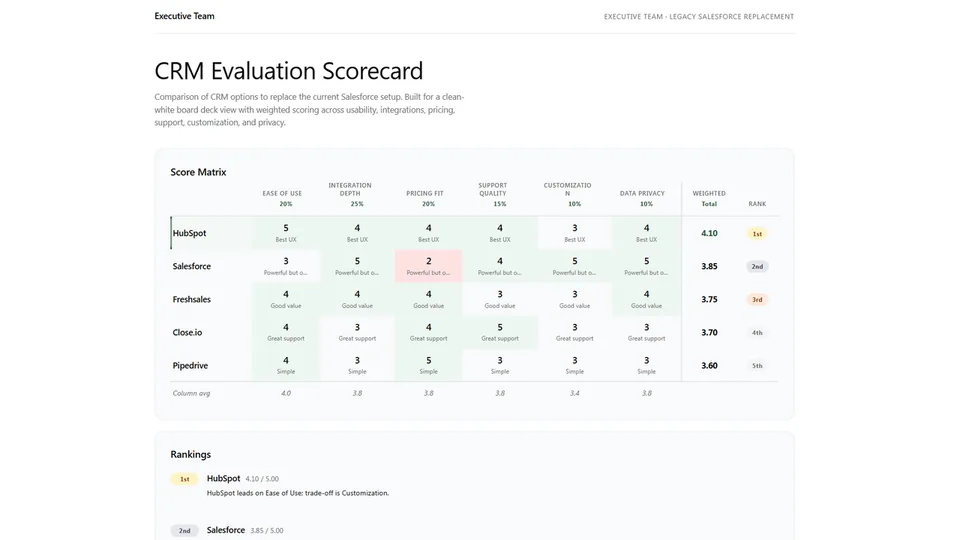
Generates a complete, self-contained HTML heatmap scorecard by interviewing the user or parsing their data, normalizing weights, constructing a validated JSON document, then rendering it into a sandbox-safe HTML file. Used for vendor evaluation, tool assessment, candidate scoring, competitive analysis, and any weighted multi-criteria ranking.
Pre-computes all heatmap cell backgrounds (low/mid/high tiers) and embeds them as inline styles — no JavaScript required for coloring. Includes gold/silver/bronze rank badges, a winner-row accent, a column averages row, and a rankings callout section. Four visual palette options. No external dependencies — output runs inside a SharePoint sandboxed iframe.
Generates a polished, self-contained HTML heatmap scorecard — a weighted comparison matrix where entities (rows) are scored across dimensions (columns), with computed totals, rank badges, and a winner highlight. Used for vendor evaluation, tool assessment, candidate scoring, and any weighted multi-criteria ranking.
What you get
- A complete, self-contained HTML heatmap scorecard with weighted scores, computed totals, and gold/silver/bronze rank badges
- Pre-computed heatmap cell backgrounds (low/mid/high tiers) embedded directly as inline styles — no JavaScript required for coloring
- A winner-row highlight, a column averages row, and a rankings callout section
- Four visual palette options; defaults to warm paper
When to use
Ask Copilot:
- "scorecard" / "comparison matrix" / "decision matrix"
- "vendor evaluation" / "tool assessment" / "candidate scoring"
- "which option is best" / "rank these options" / "weighted comparison"
SharePoint Skill
| Solution | Author(s) |
|---|---|
| scorecard-matrix | Zach Rosenfield | GitHub | LinkedIn |
Version history
| Version | Date | Comments |
|---|---|---|
| 1.0 | May 2026 | Initial Release |
Disclaimer
THIS CODE IS PROVIDED AS IS WITHOUT WARRANTY OF ANY KIND, EITHER EXPRESS OR IMPLIED, INCLUDING ANY IMPLIED WARRANTIES OF FITNESS FOR A PARTICULAR PURPOSE, MERCHANTABILITY, OR NON-INFRINGEMENT.
Package
Ready to install
The ZIP contains only the upload-ready inner skill folder.
View SKILL.md
---
name: scorecard-matrix
description: >
  Generates a polished, self-contained HTML heatmap scorecard — a weighted comparison
  matrix where entities (rows) are scored across dimensions (columns), with computed
  totals, rank badges, and a winner highlight. Use when asked to build a scorecard,
  comparison matrix, decision matrix, vendor evaluation, tool assessment, candidate
  scoring grid, competitive analysis, site-readiness matrix, or any weighted multi-criteria
  ranking. Interviews the user if entities or criteria are missing, constructs a validated
  JSON document, then renders it into a sandbox-safe HTML file using the component library.
  No external dependencies — output runs inside a SharePoint sandboxed iframe.
metadata:
  author: zrosenfield
---

# Scorecard Matrix

Generates a complete, self-contained HTML scorecard by (1) interviewing the user or parsing their data, (2) constructing and validating a JSON document, then (3) rendering that JSON into HTML using `assets/scorecard-matrix-template.html`. The JSON is the authoritative source of truth; the HTML is fully determined by it.

---

## Step 1: Determine the Data Source

Check what the user has already provided before asking anything:

- **SharePoint list or table**: Parse all rows. Identify entities (the things being compared) and scoring columns (the dimensions).
- **CSV or table pasted in chat**: Extract entities, dimension names, and scores directly. Do not ask for data you already have.
- **Verbal description only**: Proceed to Step 2.

---

## Step 2: Interview the User

If the data or intent is not fully clear, ask these questions in a single message — not one at a time:

1. **What are you comparing?** List the entities: vendors, tools, candidates, sites, products, options. (2–10 items.)
2. **What are the criteria?** List the dimensions you are scoring against: features, cost, fit, support, risk, readiness, etc. (2–10 items.)
3. **Weights**: How important is each dimension relative to the others? Can be given as percentages (must sum to 100%), ratios (e.g. 3:2:1), or plain priority ranking. The skill normalizes to decimals summing to 1.0.
4. **Scores**: For each entity × dimension cell: what is the score? Use whichever scale feels natural — the skill will ask you to confirm the scale (1–5 or 1–10). If scores come from data, extract them. If from judgment, prompt the user to rate each combination.
5. **Cell notes**: For any cell, is there a short phrase (under 6 words) that explains the score? Optional but valuable.
6. **Context sentence**: One or two sentences describing the decision being made, the audience, and the date or period.
7. **Palette**: Warm paper (cream/terra-cotta), deep ink (dark/gold), clean white (white/green), or slate (gray/blue)? Default to warm paper.

Confirm your understanding of the full matrix before building the JSON.

---

## Step 3: Normalize Weights

Weights must sum to exactly 1.0. Apply these rules:

- **Percentages given**: divide each by 100. Check sum = 1.0. If not, normalize: `w_i = raw_i / sum(raw)`.
- **Ratios given** (e.g. 3:2:2:1): `w_i = ratio_i / sum(ratios)`.
- **Priority ranking only**: assign equal weight: `w_i = 1 / N` where N = number of dimensions.
- **Weights already decimal**: verify sum. If off by ≤ 0.01 due to rounding, adjust the largest weight to compensate.

Always document the normalized weights in the JSON and show the user before rendering.

---

## Step 4: Choose the Scoring Scale

Default to **1–5** unless:
- The user provides scores already on a 1–10 scale, or
- There are 8+ dimensions and fine-grained differentiation matters.

When prompting the user to rate cells manually, describe each anchor:
- **1–5 scale**: 1 = very poor fit, 3 = adequate, 5 = exceptional.
- **1–10 scale**: 1 = unacceptable, 5 = meets minimum bar, 10 = best in class.

---

## Step 5: Build and Validate the JSON Document

Construct the JSON object. Read `references/components.md` for the full schema and computation rules.

**Top-level structure:**

```
{
  "report": {
    "title": "CRM Platform Evaluation",
    "subtitle": "Q2 2026 · Vendor Selection",
    "context": "Evaluating five CRM platforms for the SMB sales team...",
    "palette": "warm-paper",
    "footer": "Generated May 28, 2026 · 5 vendors · 6 dimensions"
  },
  "scale": 5,
  "dimensions": [...],
  "entities": [...]
}
```

**Computed fields** (the skill must calculate these before rendering):

- `weighted_total` per entity = `sum(score_d × weight_d)` for all dimensions d
- `rank` per entity = 1-based position sorted by `weighted_total` descending; ties share the lower rank number
- `column_avg` per dimension = average score across all entities (round to 1 decimal)

### Validation Checklist

Run every check before rendering. Fix any failure before proceeding.

**Document level:**
- [ ] `report.palette` is one of: `warm-paper`, `deep-ink`, `clean-white`, `slate`
- [ ] `scale` is `5` or `10`
- [ ] `dimensions` array has 2–10 items
- [ ] `entities` array has 2–10 items
- [ ] All dimension `weight` values are decimals; they sum to 1.0 (± 0.005 tolerance for rounding)
- [ ] Every dimension has a unique `id`
- [ ] Every entity has a unique `id`

**Per entity:**
- [ ] `scores` object has a key for every dimension `id`
- [ ] Every `score` value is a number in range [1, scale]
- [ ] `weighted_total` has been computed and rounded to 2 decimal places
- [ ] `rank` has been assigned (1 = best)

**Per dimension:**
- [ ] `column_avg` has been computed
- [ ] `weight` is a number in (0, 1]

---

## Step 6: Render the HTML

1. Read `assets/scorecard-matrix-template.html`.
2. Replace `{{REPORT_TITLE}}` in `<title>` with a concise page title.
3. Replace `{{PALETTE_CLASS}}` on `<body>` with `palette-` + the palette name.
4. Generate the header HTML (`.rpt-header` + `.sc-title-block`) and replace `{{HEADER}}`.
5. Generate the full matrix table HTML and replace `{{MATRIX}}`. See `references/components.md` for the matrix structure, heatmap cell style computation, rank badge HTML, and averages row.
6. Generate the rankings callout HTML and replace `{{RANKINGS}}`.
7. Generate the dimension weights note HTML and replace `{{WEIGHTS_NOTE}}`.
8. Replace `{{FOOTER}}` with the footer text.
9. Deliver the complete file as the response. No prose outside the file.

### Heatmap Cell Style Computation

For each score cell, compute a background color based on the normalized score. Read `references/design-system.md` for the exact hex values per palette tier. The formula:

```
t = (score - 1) / (scale - 1)   // normalized 0.0–1.0
tier: t < 0.35  → low  (cool tint toward negative)
      t ≥ 0.65  → high (warm tint toward accent)
      else      → mid  (surface, neutral)
```

Emit the computed hex directly as an inline `style="background:{{HEX}}"` on each score cell. No JS is needed — the page is fully readable with scripts disabled.

---

## Hard Constraints

- No external URLs, CDN links, or web fonts in the output HTML.
- No `<script src>` tags. All JavaScript must be inline.
- All data values must be pre-rendered into the HTML — the page must be fully correct with JavaScript disabled.
- Do not generate Python, PowerShell, or any other scripts — output is always the HTML file.
- Do not render until the validation checklist passes.
- Follow the no-Person-column-type rule for any accompanying SharePoint schema: use text columns only.
References
- agentskills.io specification
The specification that SharePoint AI skills follow for installation and discovery.
Discuss this skill
Ask a question, share how you used it, or suggest an improvement with the community.
Open GitHub Discussions