
 Preview unavailable
The idea behind the sample
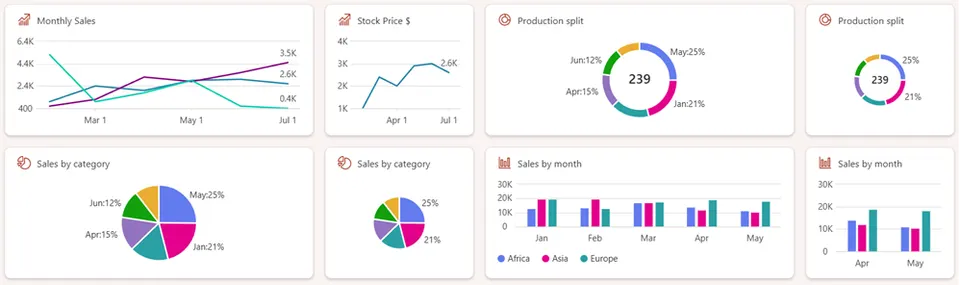
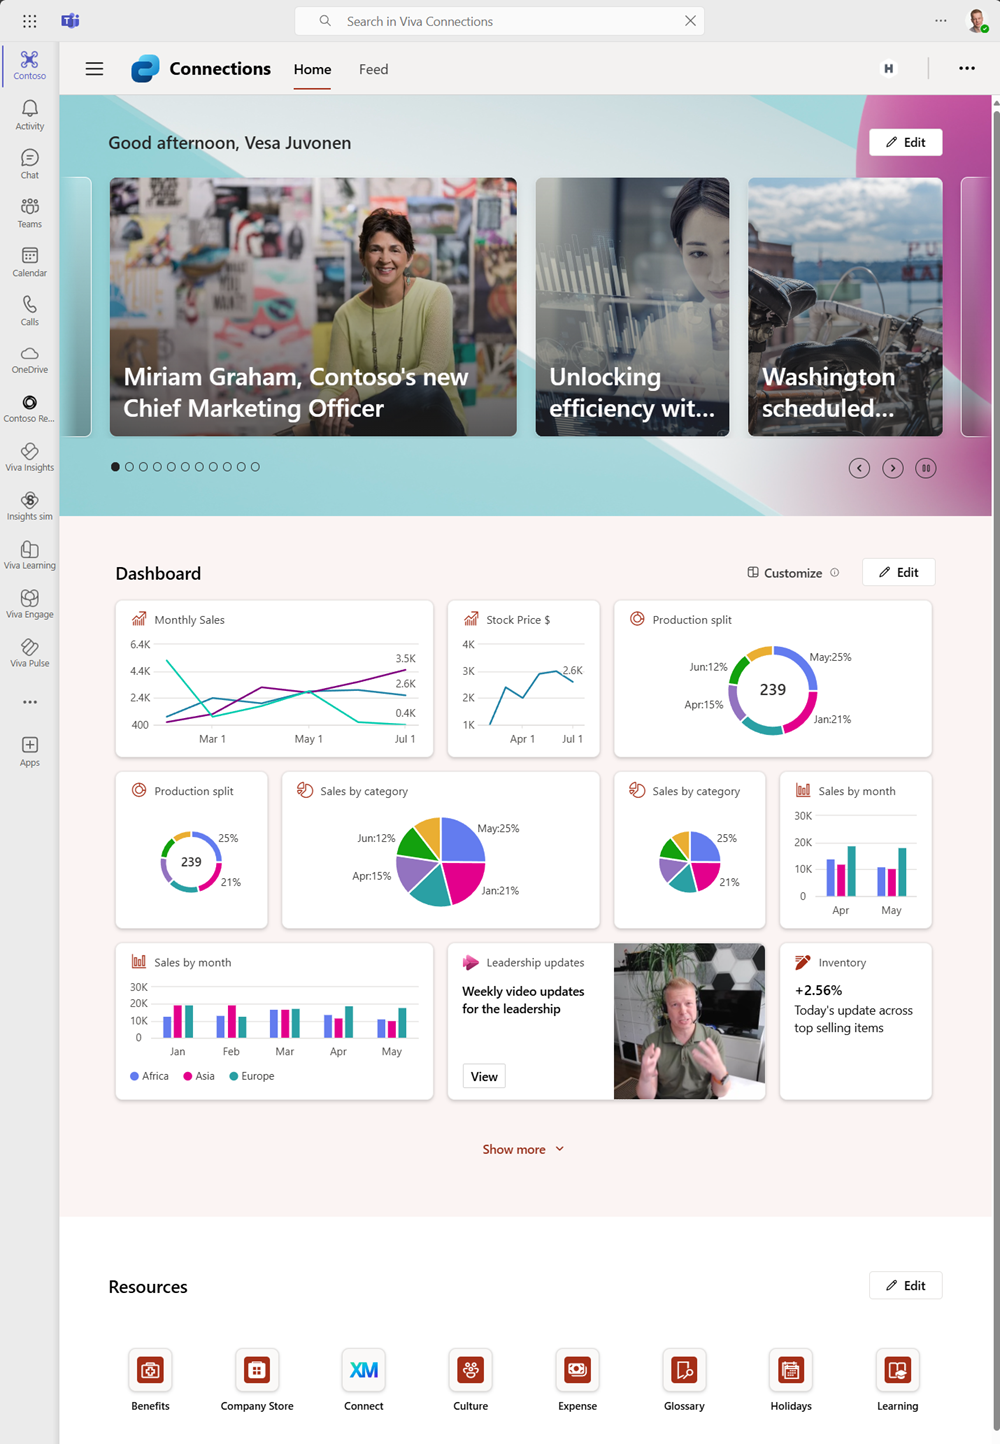
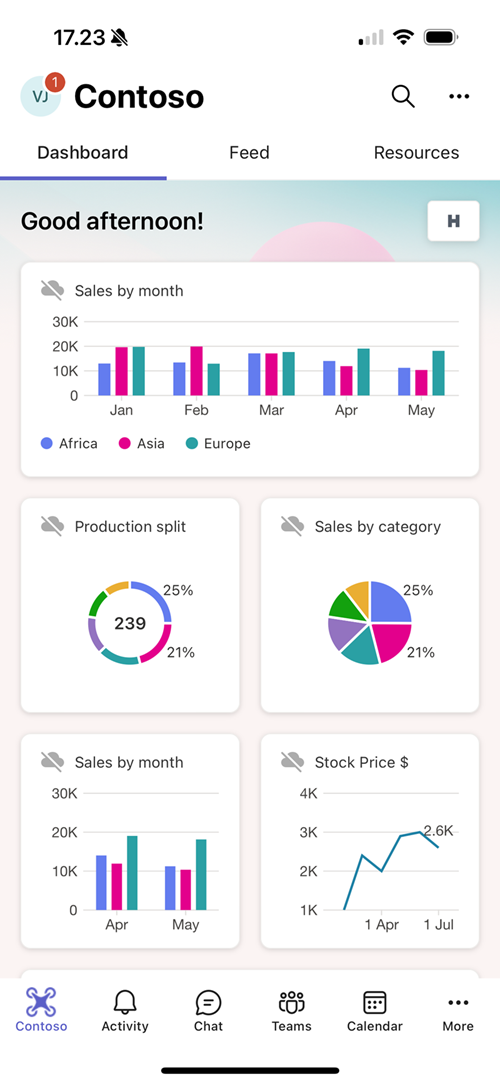
This is a baseline solution demonstrating the different data visualization options for the Viva Connections Cards. Line chart support was released as part of the SharePoint Framework 1.19 release and additional bar chart, pie chart and donut charts were introduced with the SharePoint Framework 1.20 release. Data visualization cards can be used to surface relevant business metrics directly in the Viva Connections dashboard, which can be easily accessed using desktop, tablet or mobile experiences.
Make it your own
Start with the author's setup instructions, explore the implementation, and adapt the pattern to your environment. Sample code stays in its original repository, together with its requirements, license and contribution history.
Read the source documentationA closer look
 Preview unavailable
 Preview unavailable
Keep exploring
- Viva Connections Extensibility guidance — Adaptive Card Extensions are client-side components that run in the context of a SharePoint page.
- Adaptive Card Documentation — Detailed documentation on Adaptive Cards including the Adaptive Card designer.
- Adaptive Card Extension Design Guidance — Design guidance for laying out Adaptive Card Extensions.
View 7 source metadata notes
- downloadUrl: No download link; derive one explicitly in the future gallery.
- metadata.SPFX-VERSION: Legacy major.minor version accepted for filtering; supply a patch version for reproducibility.
- thumbnails[0].alt: Replace generic alt text with a description of the sample.
- thumbnails[1].alt: Replace generic alt text with a description of the sample.
- thumbnails[1].order: Preview order is duplicated.
- thumbnails[2].alt: Replace generic alt text with a description of the sample.
- thumbnails[2].order: Preview order is duplicated.