
 Preview unavailable
The idea behind the sample
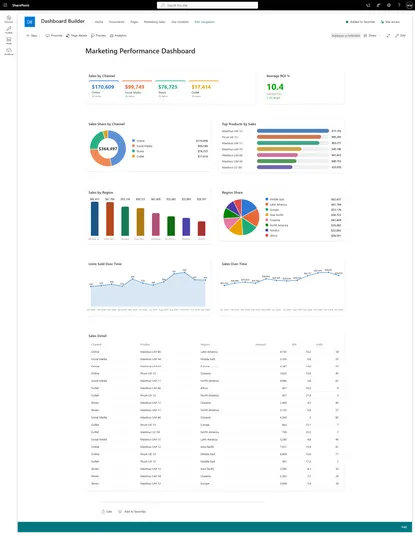
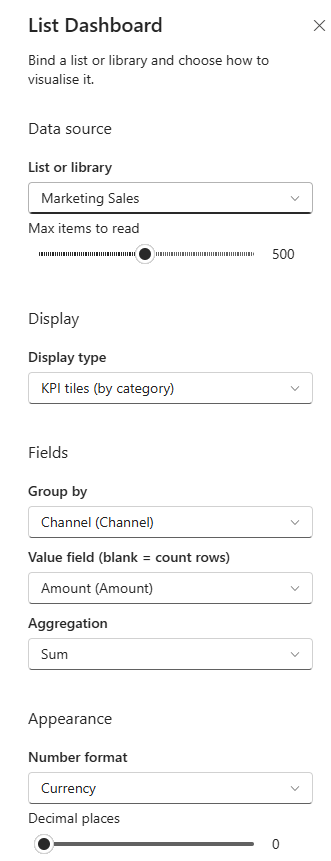
List Dashboard is a single, versatile web part that visualizes any SharePoint list or library without Power BI. Pick a list, choose a display type, and it renders: a single Stat number, KPI Tiles by category, Bar or Column charts, Pie or Donut, a Line or Area trend over a date column (bucketed by day, week, or month), or a sortable Table.
Numeric columns can be aggregated (count, sum, average, min, max) and grouped by a category column. Colour modes include a colourblind-safe categorical palette (Vibrant, Soft, Mild, Deep), a value gradient, and status-vs-target colouring (green/amber/red against thresholds, each paired with a glyph so colour is never the only signal). Values format as compact, plain number, currency, or percent of total. Because it is one configurable web part, you place it several times on a page to compose a full dashboard from your own lists.
Every visual is pure CSS or inline SVG and theme-aware, so there is no external charting dependency and no Power BI licence required. It reads each list's real columns, expands person/lookup fields correctly, ignores fields not on the bound list, and supports full-width sections. It ships with built-in demo data so every display type renders the moment you drop it on a page, before you bind a list.
Make it your own
Start with the author's setup instructions, explore the implementation, and adapt the pattern to your environment. Sample code stays in its original repository, together with its requirements, license and contribution history.
Read the source documentationA closer look
 Preview unavailable
Keep exploring
- Build your first SharePoint client-side web part — Client-side web parts are custom controls that appear inside the SharePoint page.