
 Preview unavailable
The idea behind the sample
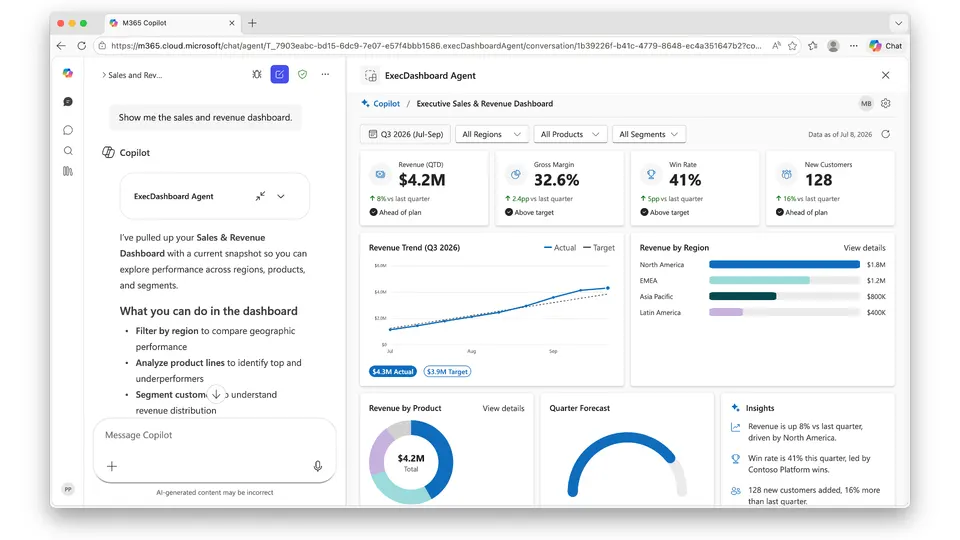
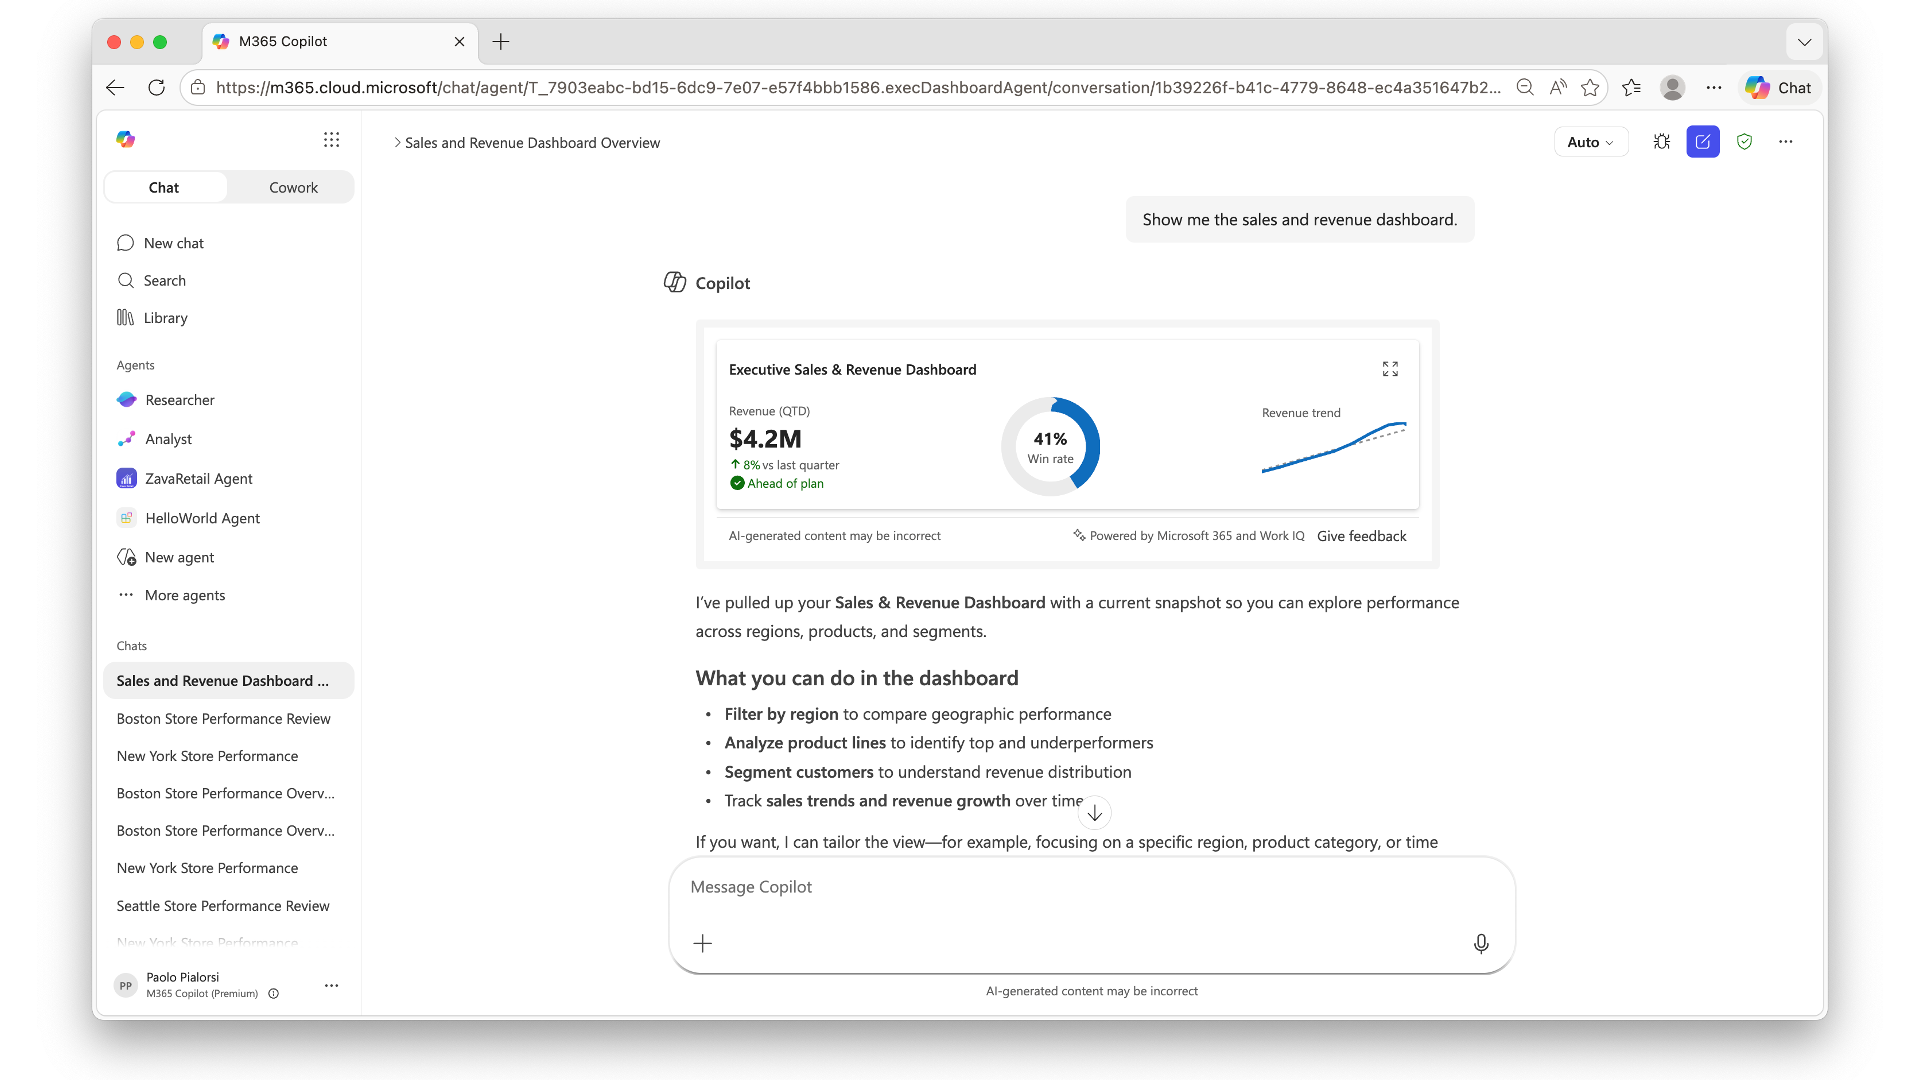
A SharePoint Framework Copilot Component (React 18.3.1 + Fluent UI v9) that surfaces an Executive Sales & Revenue Dashboard directly inside Microsoft Copilot. It renders a compact inline card and, on request, a rich full-screen dashboard, switching on the host displayMode. All data comes from a locally generated, Graph-shaped mock so the sample runs fully offline; a data-service interface plus a useMock flag make switching to a real backend a drop-in change.
Features include KPI cards, an actual-vs-target revenue trend, revenue by region and by product, a quarter-forecast gauge, generated insights, host-driven light/dark theming, a gear-activated settings panel, filters (region/product/segment) that noticeably reshape the data, and a data-loading spinner. All charts are drawn with inline SVG (no external chart library).
Make it your own
Start with the author's setup instructions, explore the implementation, and adapt the pattern to your environment. Sample code stays in its original repository, together with its requirements, license and contribution history.
Read the source documentationA closer look
 Preview unavailable
Keep exploring
- Overview of the SharePoint Framework — The SharePoint Framework (SPFx) is a page and web part model that provides full support for client-side SharePoint development, easy integration with SharePoint data, and support for open-source tooling.
- Microsoft Copilot — Microsoft Copilot combines the power of large language models with your organization's data to help you be more productive.
- Use Microsoft Graph in your solution — Microsoft Graph is the gateway to data and intelligence in Microsoft 365, exposing REST APIs and client libraries to access data across Microsoft 365 services.