
Back to column formats
Column formattingSharePoint Online

Doughnut Chart

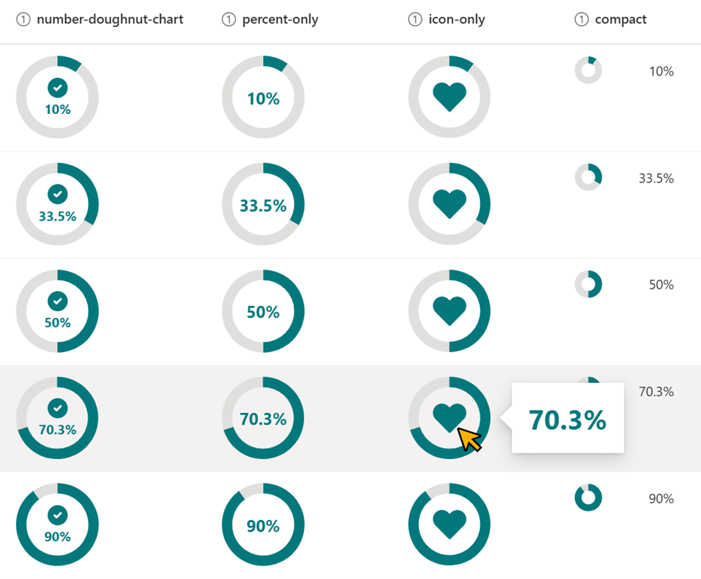
Changes the appearance of the values in number columns (percent) to a donut chart.

Doughnut Chart formatting preview
Sample preview · View original image

Copy. Apply. Make it yours.

Get this format

4 definitions

Review the requirements below, then paste this JSON into the matching formatting panel. Show me where.

Use your list's internal column names and replace any tenant-specific URLs or flow IDs. Formatting is presentation, not a way to secure data.

Column formatting
Download JSON
{
  "$schema": "https://developer.microsoft.com/json-schemas/sp/v2/column-formatting.schema.json",
  "elmType": "div",
  "style": {
    "display": "=if(@currentField=='','none','flex')",
    "justify-content": "space-between",
    "padding": "0px 10px",
    "max-width": "100px"
  },
  "children": [
    {
      "elmType": "div",
      "style": {
        "min-width": "25px",
        "min-height": "25px",
        "position": "relative",
        "margin-right": "10px"
      },
      "children": [
        {
          "elmType": "svg",
          "style": {
            "fill": "currentColor",
            "position": "absolute",
            "top": "0",
            "right": "0"
          },
          "attributes": {
            "viewBox": "0 0 600 600",
            "class": "ms-fontColor-neutralQuaternaryAlt"
          },
          "children": [
            {
              "elmType": "path",
              "attributes": {
                "d": "M300,0 A300,300 0 1,1 299.9990166,0.0000016 L299.9995083,150.000001 A150,150 0 1,0 300,150 Z"
              }
            }
          ]
        },
        {
          "elmType": "svg",
          "style": {
            "fill": "currentColor",
            "position": "absolute",
            "top": "0",
            "right": "0",
            "display": "=if(@currentField < 0 , 'none' , '')"
          },
          "attributes": {
            "viewBox": "0 0 600 600",
            "class": "ms-fontColor-themePrimary"
          },
          "children": [
            {
              "elmType": "path",
              "attributes": {
                "d": "= 'M300,0 A300,300 0 ' + if(@currentField > 0.5 , '1,1 ' , '0,1 ') + (300 + 300 * sin(360 * if(@currentField > 1 , 1 , @currentField) * (3.14159 / 180))) + ',' + (300 - 300 * cos(360 * if(@currentField > 1 , 1 , @currentField) * (3.14159 / 180))) + ' L' + (300 + 150 * sin(360 * if(@currentField > 1 , 1 , @currentField) * (3.14159 / 180))) + ',' + (300 - 150 * cos(360 * if(@currentField > 1 , 1 , @currentField) * (3.14159 / 180))) + ' A150,150 0 ' + if(@currentField > 0.5 , '1,0 ' , '0,0 ') + ' 300,150 Z'"
              }
            }
          ]
        }
      ]
    },
    {
      "elmType": "div",
      "txtContent": "@currentField.displayValue",
      "style": {
        "text-overflow": "ellipsis",
        "overflow": "hidden"
      }
    }
  ]
}

From the contributor

How to use this sample

Summary

This sample changes the appearance of the values in number columns (percent) to a donut chart. The donut chart is displayed using svg.
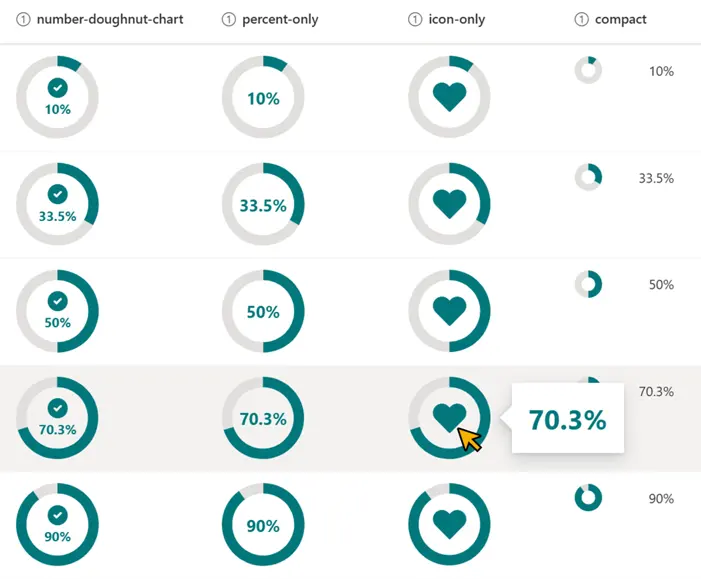
screenshot of the sample

View requirements

This format can be applied to a Number column. It is expected that the values will be from 0 to 1 (percent).

Sample

Solution Author(s)
number-doughnut-chart.json Tetsuya Kawahara
number-doughnut-chart-percent-only.json Tetsuya Kawahara
number-doughnut-chart-icon-only.json Tetsuya Kawahara
number-doughnut-chart-compact.json Tetsuya Kawahara

Version history

Version Date Comments
1.0 August 20, 2021 Initial release
1.1 October 3, 2021 Fixed the display when the value is less than 0% and greater than 100%.
1.2 April 12, 2025 Added number-doughnut-chart-compact.json

Disclaimer

THIS CODE IS PROVIDED AS IS WITHOUT WARRANTY OF ANY KIND, EITHER EXPRESS OR IMPLIED, INCLUDING ANY IMPLIED WARRANTIES OF FITNESS FOR A PARTICULAR PURPOSE, MERCHANTABILITY, OR NON-INFRINGEMENT.


Additional notes

This sample uses icons from the Fluent UI