
From the contributor
How to use this sample
Summary
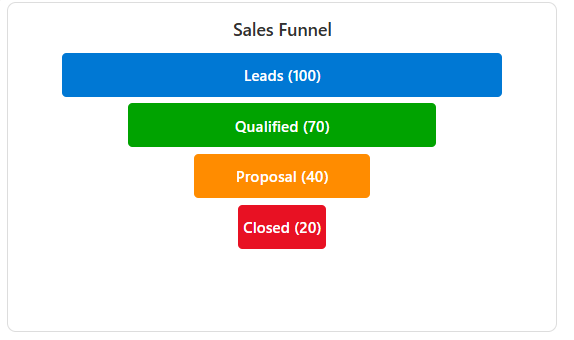
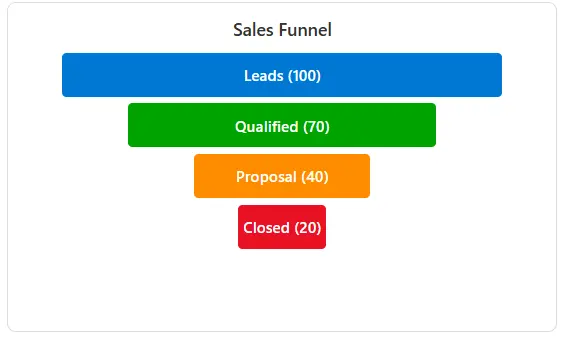
This sample demonstrates how to render a Funnel Chart inside a Tile card style view in SharePoint.
The funnel chart is useful for visualizing pipeline stages such as Leads → Qualified → Proposal → Closed, with stage widths proportional to numeric values.
View requirements
Before starting, ensure you have:
- SharePoint Online access with list creation permissions
- A Custom List (we'll create this together)
Step 1: Create Your SharePoint List
- Navigate to your SharePoint site
- Click "New" → "List"
- Select "Blank list"
- Name your list (e.g., "Sales Funnel Dashboard")
- Click "Create"
Step 2: Add Required Columns
You need to add these columns to your newly created list:
Add Each Column:
- Click "Add column" in your list
- Select the column type from the table below
- Enter the column name exactly as shown
- Click "Save"
| Column Name | Type | Notes |
|---|---|---|
| Title | Single line text | Already exists by default |
| Stage1 | Number | First stage value |
| Stage1Label | Single line text | First stage name |
| Stage1Color | Single line text | First stage color (hex code) |
| Stage2 | Number | Second stage value |
| Stage2Label | Single line text | Second stage name |
| Stage2Color | Single line text | Second stage color (hex code) |
| Stage3 | Number | Third stage value |
| Stage3Label | Single line text | Third stage name |
| Stage3Color | Single line text | Third stage color (hex code) |
| Stage4 | Number | Fourth stage value |
| Stage4Label | Single line text | Fourth stage name |
| Stage4Color | Single line text | Fourth stage color (hex code) |
Step 3: Add Sample Data
Add a test item to see your funnel chart:
- Click "New" in your list
- Fill in these sample values:
- Title: Sales Funnel Q3
- Stage1: 100, Stage1Label: Leads, Stage1Color: #0078d4
- Stage2: 75, Stage2Label: Qualified, Stage2Color: #00a300
- Stage3: 45, Stage3Label: Proposal, Stage3Color: #ff8c00
- Stage4: 25, Stage4Label: Closed, Stage4Color: #e81123
- Click "Save"
Step 4: Apply the Funnel Chart Formatting
Create and Format the View:
- Click the view dropdown (next to "All Items")
- Select "Create new view"
- Choose "Gallery" layout
- Name your view "Funnel Chart View"
- Click "Create"
- Click the Funnel Chart View dropdown
- Click "Format current view"
- Click "Advanced mode"
- Copy the entire JSON code from the
funnel-chart-tile.jsonfile - Paste it into the formatting panel
- Click "Preview" to see your funnel chart
- Click "Save" to apply the formatting
Troubleshooting
Funnel not showing?
- Verify all required columns exist
- Check that your sample data has numeric values in Stage columns
- Ensure you're in Tiles view layout
Stages too narrow?
- Increase the numeric values in your stage columns
- The width is calculated as: Stage Value × 4 pixels
Colors not working?
- Use proper hex color format: #000000
- Avoid color names like "red" or "blue"
Sample
| Solution | Author(s) |
|---|---|
| funnel-chart-tile.json | Sai Bandaru |
Version History
| Version | Date | Comments |
|---|---|---|
| 1.0 | Sep 04, 2025 | Initial release |
Disclaimer
THIS CODE IS PROVIDED AS IS WITHOUT WARRANTY OF ANY KIND, EITHER EXPRESS OR IMPLIED, INCLUDING ANY IMPLIED WARRANTIES OF FITNESS FOR A PARTICULAR PURPOSE, MERCHANTABILITY, OR NON-INFRINGEMENT.