
From the contributor
How to use this sample
Summary
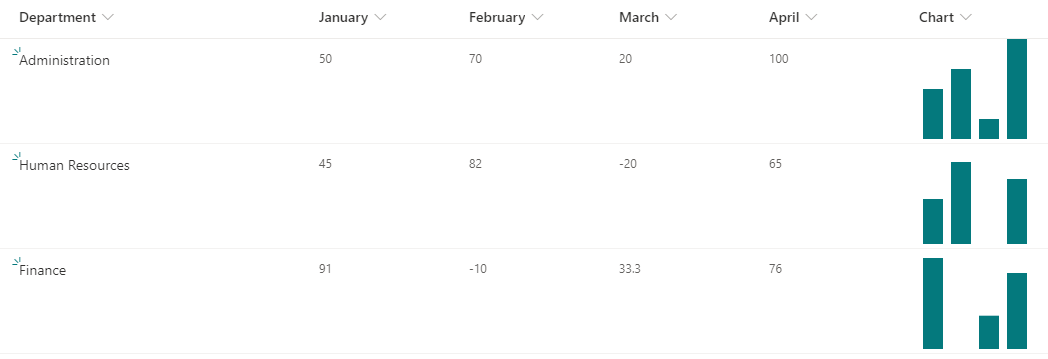
This sample demonstrates displaying a column chart using SVG. It uses the currentColor for the fill value of the SVGs which allows us to use a theme class to make the final SVGs fit your site's theme.
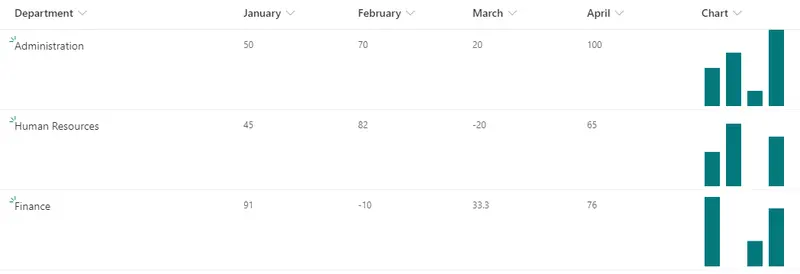
This example shows values from 0 to 100. You can adjust this scale by changing the d attribute of the path elements to calculate a percentage rather than use the value directly.
View requirements
This format can be applied to any column type. However, it expects to have 4 number columns in the view.
| Column Name | Type |
|---|---|
| January | Number |
| February | Number |
| March | Number |
| April | Number |
| Chart | Any |
The column where you apply your format (Chart above) can be any type since it's value is ignored. A calculated column with a formula of ="" will prevent the field from showing up on your forms.
Adapting to your fields
This sample can easily be adjusted to work with your columns. Each chart column uses the internal name of a field 3 times. You can replace these with your own fields. You can also add additional columns by copying one of the child div elements and changing the referenced field.
Sample
| Solution | Author(s) |
|---|---|
| generic-column-chart.json | Tetsuya Kawahara |
Version history
| Version | Date | Comments |
|---|---|---|
| 1.0 | October 10, 2020 | Initial release |
Disclaimer
THIS CODE IS PROVIDED AS IS WITHOUT WARRANTY OF ANY KIND, EITHER EXPRESS OR IMPLIED, INCLUDING ANY IMPLIED WARRANTIES OF FITNESS FOR A PARTICULAR PURPOSE, MERCHANTABILITY, OR NON-INFRINGEMENT.