
Back to column formats
Column formattingSharePoint Online

One Point Chart

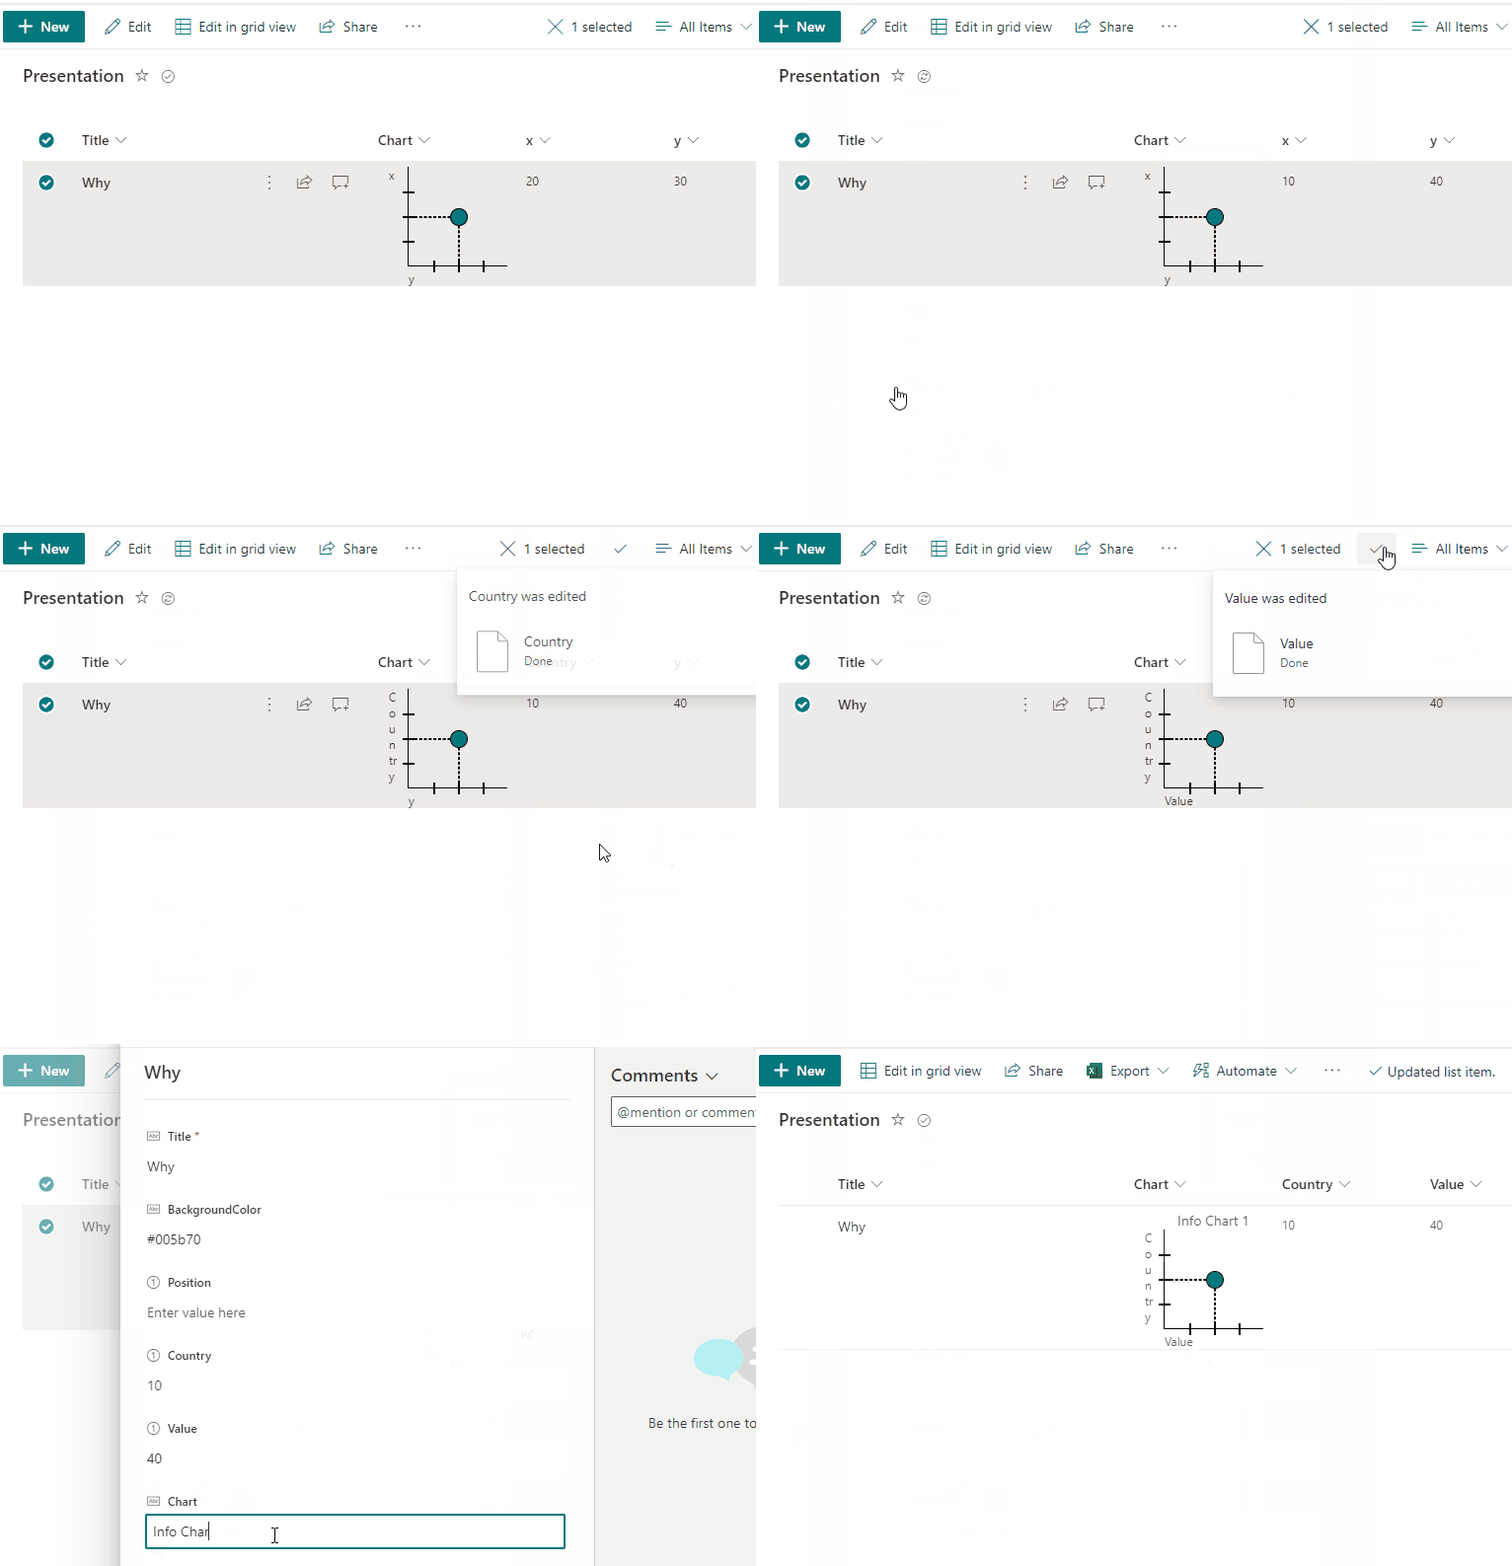
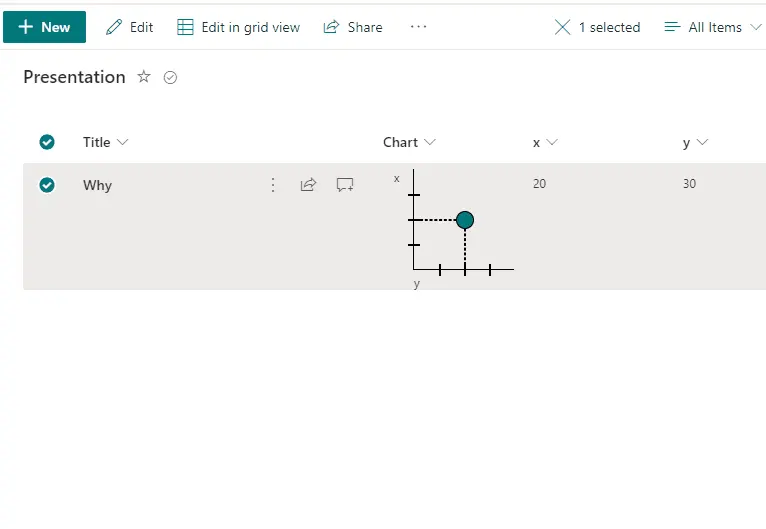
This sample demonstrates making one point chart with support of 2 numeric fields (x,y) with dialog description.
One Point Chart formatting preview
Sample preview · View original animation

Copy. Apply. Make it yours.

Get this format

1 definition

Review the requirements below, then paste this JSON into the matching formatting panel. Show me where.

Use your list's internal column names and replace any tenant-specific URLs or flow IDs. Formatting is presentation, not a way to secure data.

Column formatting
Download JSON
{
  "$schema": "https://developer.microsoft.com/json-schemas/sp/v2/column-formatting.schema.json",
  "elmType": "div",
  "style": {
    "padding": "5px 0px 20px 30px"
  },
  "children": [
    {
      "elmType": "div",
      "children": [
        {
          "elmType": "div",
          "style": {
            "text-align": "center",
            "font-size": "14px"
          },
          "txtContent": "@currentField",
          "inlineEditField": "@currentField"
        },
        {
          "elmType": "div",
          "style": {
            "height": "100px",
            "width": "100px",
            "border-left": "1px solid black",
            "border-bottom": "1px solid black"
          },
          "children": [
            {
              "elmType": "div",
              "style": {
                "position": "relative"
              },
              "children": [
                {
                  "elmType": "div",
                  "style": {
                    "position": "absolute",
                    "width": "10px",
                    "top": "0px",
                    "left": "-20px",
                    "font-size": "12px"
                  },
                  "txtContent": "[!x.DisplayName]"
                },
                {
                  "elmType": "div",
                  "style": {
                    "position": "absolute",
                    "border": "1px solid black",
                    "width": "10px",
                    "top": "25px",
                    "left": "-6px"
                  }
                },
                {
                  "elmType": "div",
                  "style": {
                    "position": "absolute",
                    "border": "1px solid black",
                    "width": "10px",
                    "top": "50px",
                    "left": "-6px"
                  }
                },
                {
                  "elmType": "div",
                  "style": {
                    "position": "absolute",
                    "border": "1px solid black",
                    "width": "10px",
                    "top": "75px",
                    "left": "-6px"
                  }
                },
                {
                  "elmType": "div",
                  "style": {
                    "position": "absolute",
                    "border": "1px solid black",
                    "height": "10px",
                    "top": "95px",
                    "left": "25px"
                  }
                },
                {
                  "elmType": "div",
                  "style": {
                    "position": "absolute",
                    "border": "1px solid black",
                    "height": "10px",
                    "top": "95px",
                    "left": "50px"
                  }
                },
                {
                  "elmType": "div",
                  "style": {
                    "position": "absolute",
                    "border": "1px solid black",
                    "height": "10px",
                    "top": "95px",
                    "left": "75px"
                  }
                },
                {
                  "elmType": "div",
                  "style": {
                    "position": "absolute",
                    "height": "10px",
                    "top": "105px",
                    "left": "0px",
                    "font-size": "12px"
                  },
                  "txtContent": "[!y.DisplayName]"
                },
                {
                  "elmType": "div",
                  "style": {
                    "position": "absolute",
                    "border": "1px dashed black",
                    "width": "44px",
                    "top": "50px",
                    "left": "6px"
                  }
                },
                {
                  "elmType": "div",
                  "style": {
                    "position": "absolute",
                    "border": "1px dashed black",
                    "height": "44px",
                    "top": "50px",
                    "left": "50px"
                  }
                },
                {
                  "elmType": "div",
                  "style": {
                    "border-radius": "50%",
                    "position": "absolute",
                    "margin": "42px",
                    "width": "16px",
                    "height": "16px",
                    "border": "1px solid black",
                    "cursor": "pointer"
                  },
                  "attributes": {
                    "class": "ms-bgColor-themePrimary"
                  },
                  "customCardProps": {
                    "openOnEvent": "hover",
                    "directionalHint": "topCenter",
                    "isBeakVisible": true,
                    "formatter": {
                      "elmType": "div",
                      "style": {
                        "padding": "10px"
                      },
                      "children": [
                        {
                          "elmType": "div",
                          "txtContent": "='('+'[!x.DisplayName]'+'='+[$x]+','+'[!y.DisplayName]'+'='+[$y]+')'"
                        }
                      ]
                    }
                  }
                }
              ]
            }
          ]
        }
      ]
    }
  ]
}

From the contributor

How to use this sample

Summary

This sample demonstrates making one point chart with support of 2 numeric fields (x,y) with dialog description.

screenshot of the sample

View requirements

The format expect the following fields:

Field Type
Chart Single line of text - Format (generic-one-point-chart.json) is added in this column
x Number - x position
y Number - y position

Sample

Solution Author(s)
generic-one-point-chart.json André Lage

Version history

Version Date Comments
1.0 March 12, 2022 Initial release

Disclaimer

THIS CODE IS PROVIDED AS IS WITHOUT WARRANTY OF ANY KIND, EITHER EXPRESS OR IMPLIED, INCLUDING ANY IMPLIED WARRANTIES OF FITNESS FOR A PARTICULAR PURPOSE, MERCHANTABILITY, OR NON-INFRINGEMENT.


Additional notes