
Back to column formats
Column formattingSharePoint 2019SharePoint Online

Pie Chart

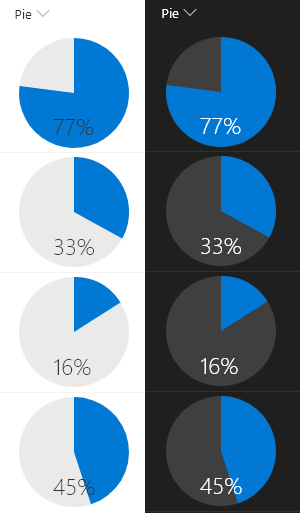
This example renders whole pie in neutralLight with radius 50 and the number% (column value) as a slice of the pie in blue using `<svg>` with `<path>` tags. The number% displayed at the bottom of the pie in neutralPrimary.

number-piechart
Sample preview · View original image

Copy. Apply. Make it yours.

Get this format

2 definitions

Review the requirements below, then paste this JSON into the matching formatting panel. Show me where.

Use your list's internal column names and replace any tenant-specific URLs or flow IDs. Formatting is presentation, not a way to secure data.

Column formatting
Download JSON
{
  "$schema": "https://developer.microsoft.com/json-schemas/sp/v2/column-formatting.schema.json",
  "elmType": "div",
  "style": {
    "display": "flex",
    "padding": "4px"
  },
  "children": [
    {
      "elmType": "div",
      "style": {
        "display": "inline-block",
        "border-radius": "100%",
        "fill": "#0078d4",
        "width": "100px",
        "height": "100px"
      },
      "attributes": {
        "class": "ms-bgColor-neutralLight"
      },
      "children": [
        {
          "elmType": "svg",
          "children": [
            {
              "elmType": "path",
              "attributes": {
                "d": "='M50,50 L50,0, A50,50 0 ' + if(@currentField <= 0.5, '0', '1') + ',1 ' + toString(50 + (sin(6.2831853 * if(@currentField >= 1, 0.9999, if(@currentField < 0, 0, @currentField))) * 50)) + ',' + toString(50 - (cos(6.2831853 * if(@currentField >= 1, 0.9999, if(@currentField < 0, 0, @currentField))) * 50)) + ' z'"
              }
            }
          ]
        }
      ]
    },
    {
      "elmType": "div",
      "style": {
        "position": "relative",
        "left": "-69px",
        "top": "30px",
        "white-space": "nowrap"
      },
      "attributes": {
        "class": "ms-fontColor-neutralPrimary ms-fontWeight-light ms-fontSize-xl"
      },
      "txtContent": "=toString(@currentField * 100) + '%'"
    }
  ]
}

From the contributor

How to use this sample

Summary

This example renders whole pie in neutralLight with radius 50 and the number% (column value) as a slice of the pie in blue using <svg> with <path> tags. The number% displayed at the bottom of the pie in neutralPrimary.

The background and text colors are set using theme values by applying classes from the Office UI Fabric. Unfortunately, there is not a theme class for fill and so the pie is set to a specific value that will not update through theme switches and so should be chosen carefully. Both a light and dark theme are shown in the screenshot below.
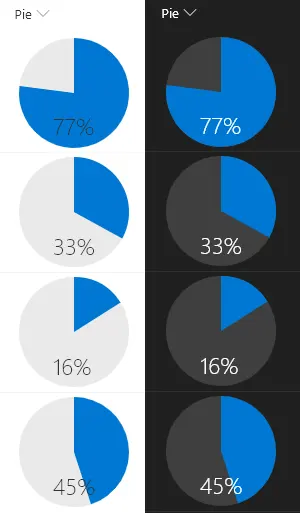
screenshot of the sample

View requirements

  • This format can be applied to a Number column

Sample

Solution Author(s)
number-piechart.json Aaron Miao, Chris Kent

Version history

Version Date Comments
1.0 Dec 13, 2017 Initial release
1.1 March 20, 2018 Added min & max values and fixed skewed drawing issue
1.2 August 20, 2018 Switched to Excel-style expressions and use of theme classes

Disclaimer

THIS CODE IS PROVIDED AS IS WITHOUT WARRANTY OF ANY KIND, EITHER EXPRESS OR IMPLIED, INCLUDING ANY IMPLIED WARRANTIES OF FITNESS FOR A PARTICULAR PURPOSE, MERCHANTABILITY, OR NON-INFRINGEMENT.


Additional notes

A similar wizard is also included in the Column Formatter webpart that allows full customization.

An additional version using Abstract Tree Syntax (AST) is also provided for environments where the Excel-style expressions are not supported.