
Back to view formats
View formattingSharePoint Online

Bar Chart Diagram

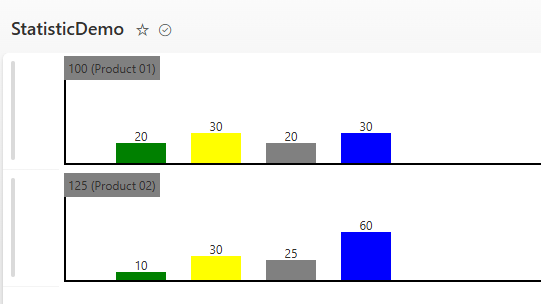
This SharePoint JSON formatting script customizes the display of a list view row by rendering a horizontal bar chart directly in the list.

Bar Chart Diagram formatting preview
Sample preview · View original image

Copy. Apply. Make it yours.

Get this format

1 definition

Review the requirements below, then paste this JSON into the matching formatting panel. Show me where.

Use your list's internal column names and replace any tenant-specific URLs or flow IDs. Formatting is presentation, not a way to secure data.

View formatting
Download JSON
{
  "$schema": "https://developer.microsoft.com/json-schemas/sp/v2/row-formatting.schema.json",
  "hideColumnHeader": true,
  "hideselection": true,
  "rowFormatter": {
    "elmType": "div",
    "style": {
      "position": "relative",
      "height": "100px",
      "display": "block",
      "padding-top": "5px",
      "margin": "5px",
      "border-left": "2px solid black",
      "border-bottom": "2px solid black"
    },
    "children": [
      {
        "elmType": "div",
        "style": {
          "position": "absolute",
          "left": "-2px",
          "top": "-2px",
          "background-color": "gray",
          "padding": "4px"
        },
        "txtContent": {
          "operator": "+",
          "operands": [
            "[$Total]",
            " (",
            "[$Title]",
            ")"
          ]
        }
      },
      {
        "elmType": "div",
        "style": {
          "display": "block",
          "margin-left": "25px"
        },
        "children": [
          {
            "elmType": "div",
            "style": {
              "display": "flex",
              "position": "relative"
            },
            "children": [
              {
                "elmType": "div",
                "style": {
                  "position": "relative",
                  "display": "=if([$Value01]>0, 'block', 'none')",
                  "height": "=(([$Value01]/[$Total])*100)+'px'",
                  "width": "50px",
                  "margin-left": "25px",
                  "margin-top": "=100-(([$Value01]/[$Total])*100)+'px'",
                  "background-color": "=if([$Total]>0, 'green', 'white')"
                },
                "children": [
                  {
                    "elmType": "span",
                    "txtContent": "=[$Value01]",
                    "style": {
                      "width": "50px",
                      "position": "absolute",
                      "top": "-15px",
                      "text-align": "center"
                    }
                  }
                ]
              },
              {
                "elmType": "div",
                "style": {
                  "position": "relative",
                  "display": "=if([$Value02]>0, 'block', 'none')",
                  "height": "=(([$Value02]/[$Total])*100)+'px'",
                  "width": "50px",
                  "margin-left": "25px",
                  "margin-top": "=100-(([$Value02]/[$Total])*100)+'px'",
                  "background-color": "yellow"
                },
                "children": [
                  {
                    "elmType": "span",
                    "txtContent": "=[$Value02]",
                    "style": {
                      "width": "50px",
                      "position": "absolute",
                      "top": "-15px",
                      "text-align": "center"
                    }
                  }
                ]
              },
              {
                "elmType": "div",
                "style": {
                  "position": "relative",
                  "display": "=if([$Value03]>0, 'block', 'none')",
                  "height": "=(([$Value03]/[$Total])*100)+'px'",
                  "width": "50px",
                  "margin-left": "25px",
                  "margin-top": "=100-(([$Value03]/[$Total])*100)+'px'",
                  "background-color": "gray"
                },
                "children": [
                  {
                    "elmType": "span",
                    "txtContent": "=[$Value03]",
                    "style": {
                      "width": "50px",
                      "position": "absolute",
                      "top": "-15px",
                      "text-align": "center"
                    }
                  }
                ]
              },
              {
                "elmType": "div",
                "style": {
                  "position": "relative",
                  "display": "=if([$Value04]>0, 'block', 'none')",
                  "height": "=(([$Value04]/[$Total])*100)+'px'",
                  "width": "50px",
                  "margin-left": "25px",
                  "margin-top": "=100-(([$Value04]/[$Total])*100)+'px'",
                  "background-color": "blue"
                },
                "children": [
                  {
                    "elmType": "span",
                    "txtContent": "=[$Value04]",
                    "style": {
                      "width": "50px",
                      "position": "absolute",
                      "top": "-15px",
                      "text-align": "center"
                    }
                  }
                ]
              }
            ]
          }
        ]
      }
    ]
  }
}

From the contributor

How to use this sample

Summary

This SharePoint JSON formatting script customizes the display of a list view row by rendering a horizontal bar chart directly in the list. For each item, the script reads numeric values from specified columns and draws proportional bars using HTML/CSS styling defined in the JSON. This provides an at-a-glance visual comparison of numbers (like progress, scores, or percentages) without leaving the list view. The formatting follows the SharePoint row formatting schema (v2), ensuring compatibility with modern SharePoint Online lists. This allows you to display a percentage bar chart that is calculated using the total value from the Total column.
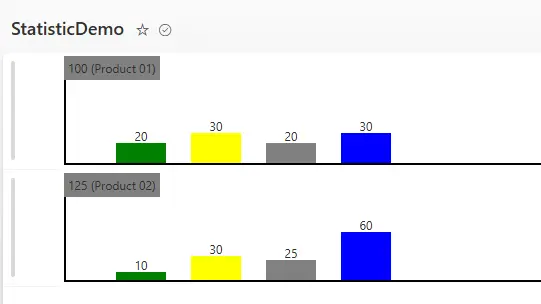
Sample output screenshot

View requirements

Column Name Type Setting
Title Single line of text -
Value01 Number without decimals
Value02 Number without decimals
Value03 Number without decimals
Value04 Number without decimals
Total Number without decimals

The Title column is used to display a title within the bar chart. Additioanl information, like a legend for each bar, is not rendered. You can provide these information directly on the page in a text web part. You can alter the count of value columns (Value01 ...). The current JSON-Format print out 4 values. For more you must alter the script. Just duplicate the output for a bar chart.

Sample Data

Title Value01 Value02 Value03 Value04 Total
IT Tickets 20 40 30 10 100
HR Tickets 10 30 80 20 140

[!NOTE] All columns must be included in the view; no special grouped-by or other settings are needed. If you alter the column names, you must adjust the names in the script. In the above example, the columns Values01 to Values04 could represent, e.g., Open, Solved, Closed, or Waiting.

Sample

Solution Author(s)
bar-chart-diagram.json Marc Andre Schröder-Zhou

Version history

Version Date Comments
1.0 February 22, 2026 Initial release.

Disclaimer

THIS CODE IS PROVIDED AS IS WITHOUT WARRANTY OF ANY KIND, EITHER EXPRESS OR IMPLIED, INCLUDING ANY IMPLIED WARRANTIES OF FITNESS FOR A PARTICULAR PURPOSE, MERCHANTABILITY, OR NON-INFRINGEMENT.