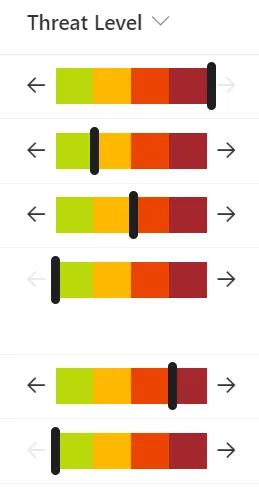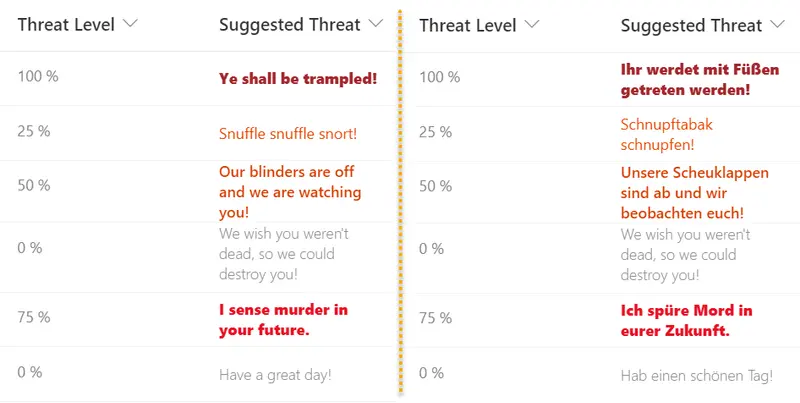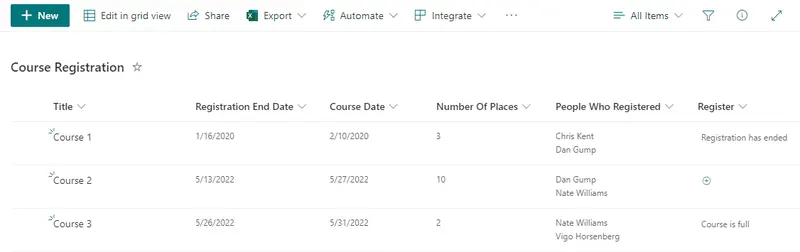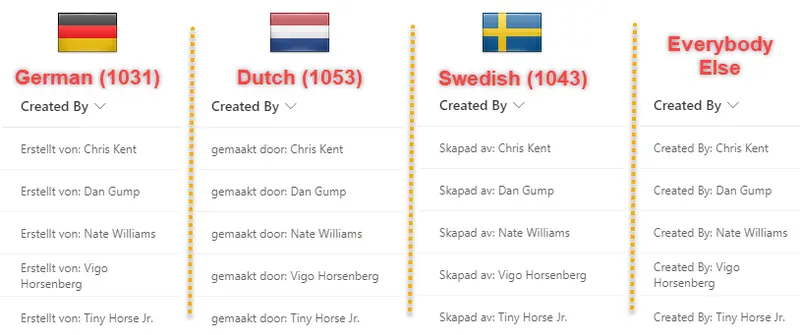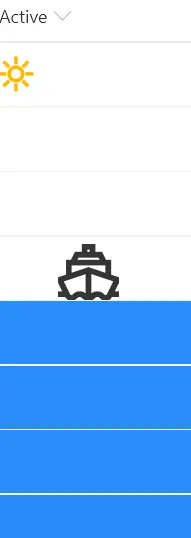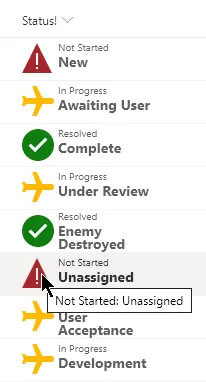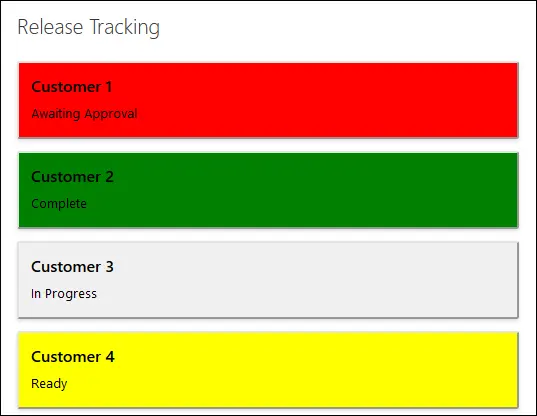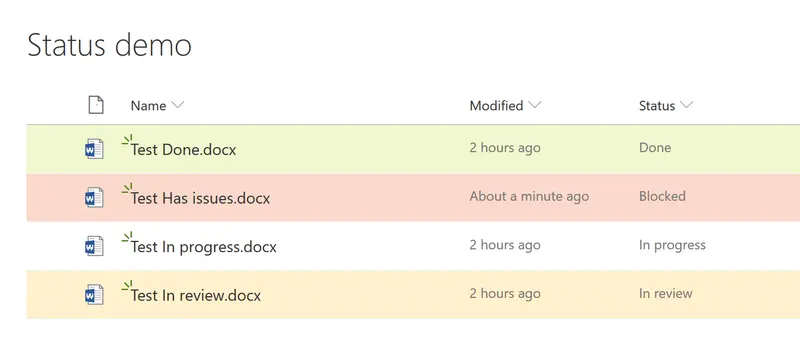
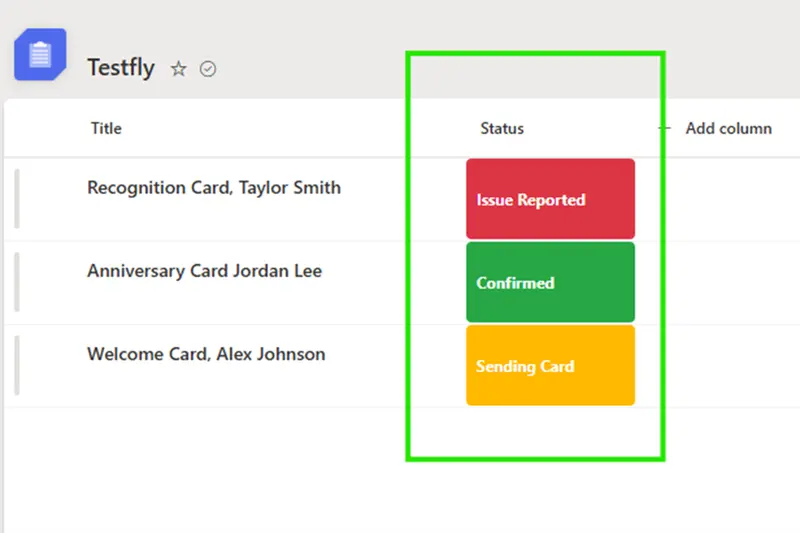
Status Column Badges
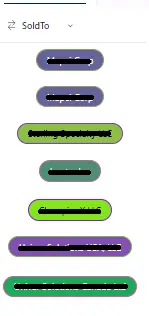
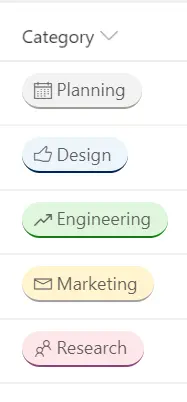
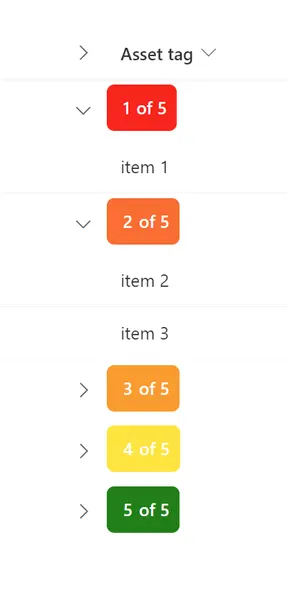
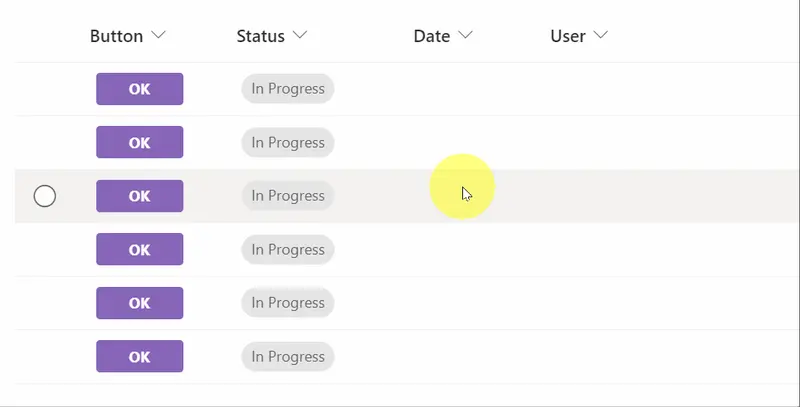
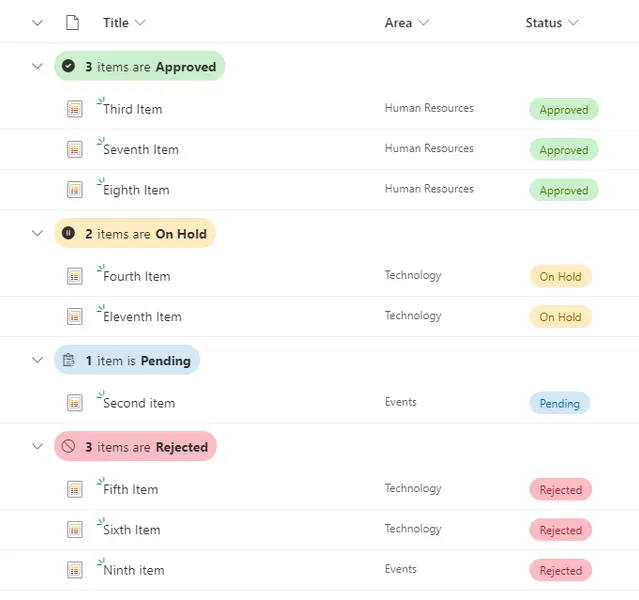
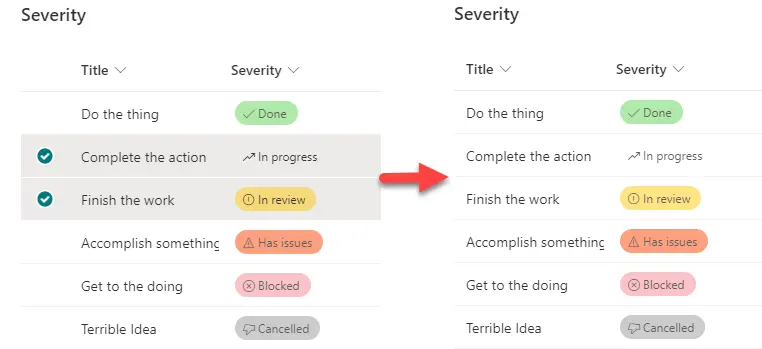
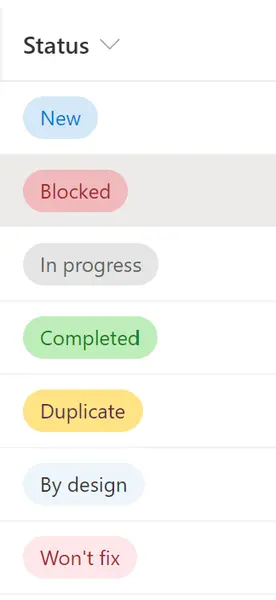
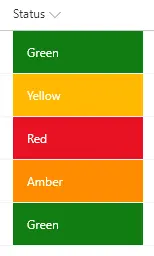
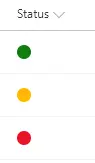
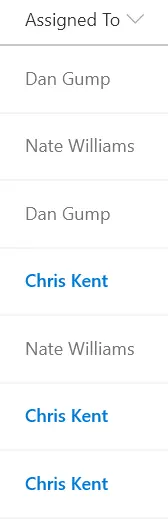
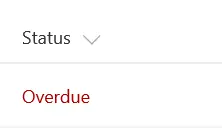
This sample uses SharePoint column formatting to display status values as simple, color-coded badges. It provides a quick visual indicator that makes list items easier to scan.
Microsoft 365 & Power Platform Community
Make SharePoint and Microsoft Lists work beautifully.
Discover a format, copy the JSON, and make it yours.
Ready to make it yours
382 community samples · Free & open source
This sample uses SharePoint column formatting to display status values as simple, color-coded badges. It provides a quick visual indicator that makes list items easier to scan.
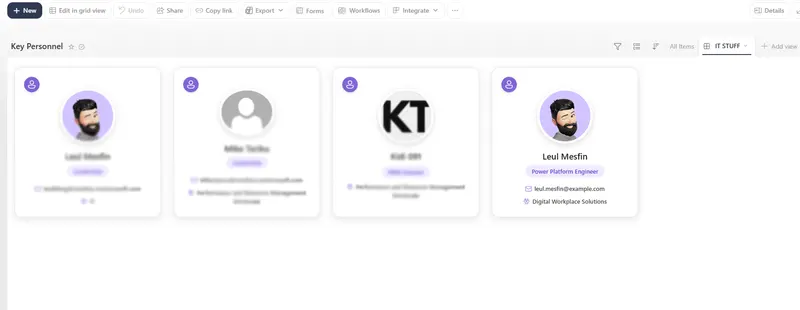
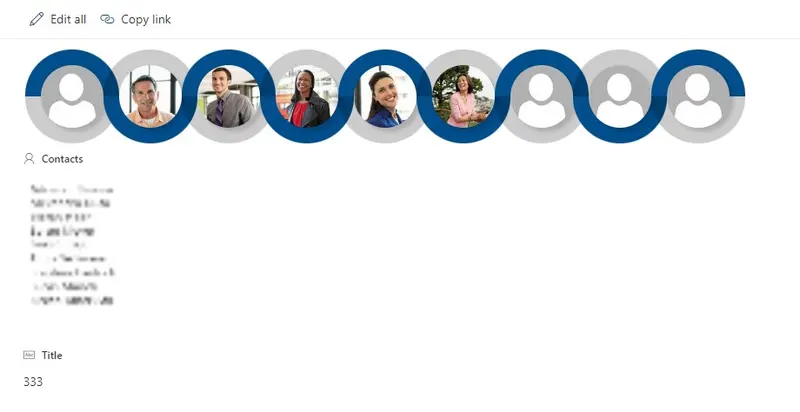
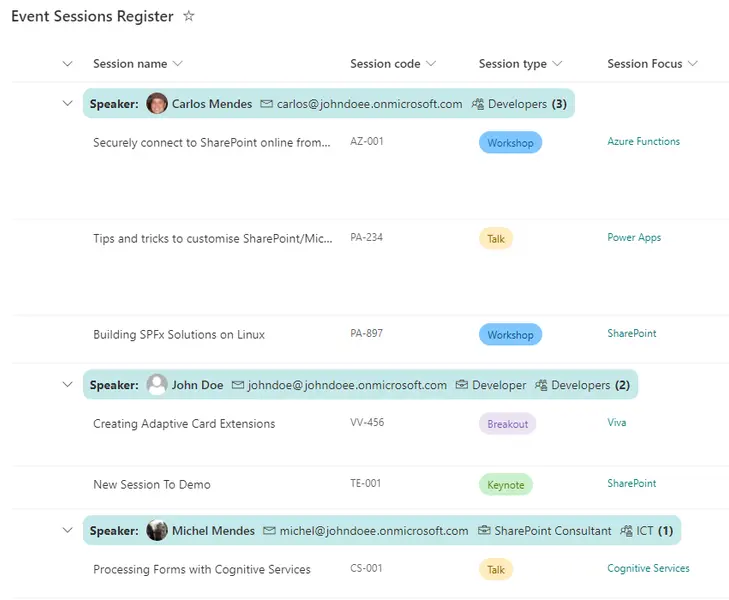
Modern responsive profile cards displaying Microsoft 365 profile pictures, names, roles, email addresses, and departments.
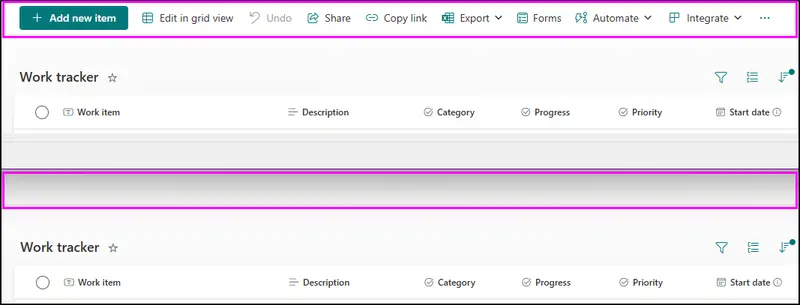
This sample demonstrates hiding all buttons on the command bar.
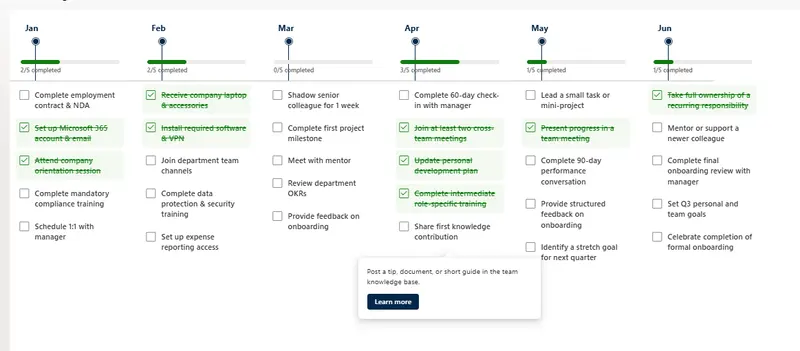
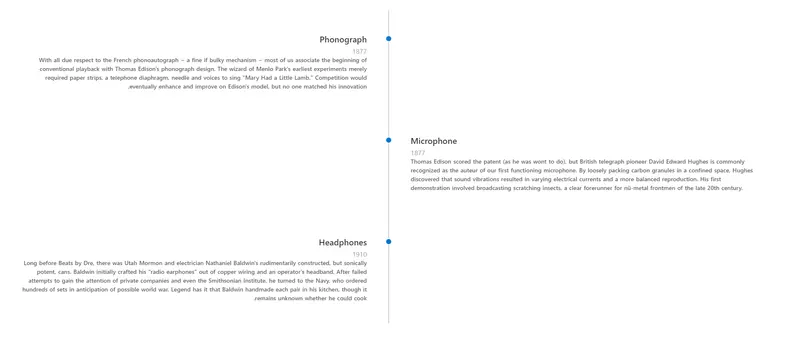
A modern horizontal timeline view that displays key dates or milestones as monthly columns.
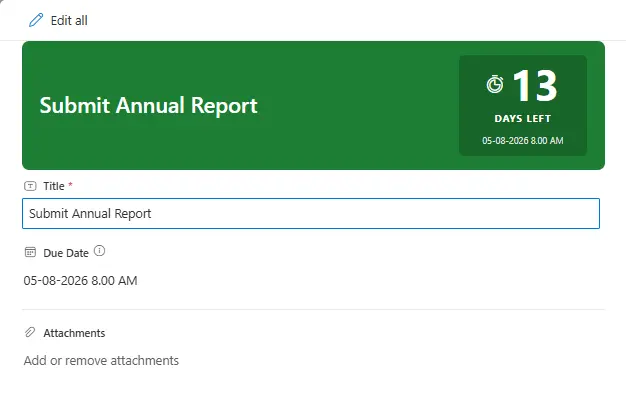
A form header formatter that displays days remaining until a due date with color-coded urgency: green (calm, >7 days), amber (warning, 4-7 days), red (urgent, 1-3 days), and crimson (overdue).
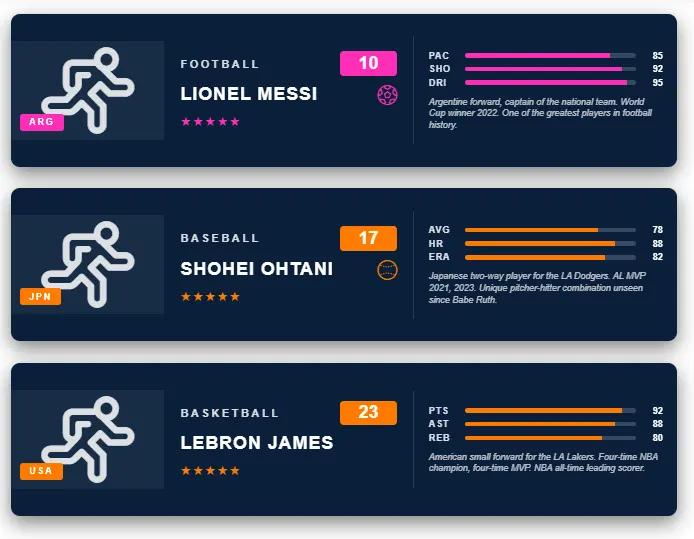
This SharePoint JSON view formatting sample transforms list items into vertical sports trading cards with header bar, country badge, player silhouette, name band, star rating and three stat bars.
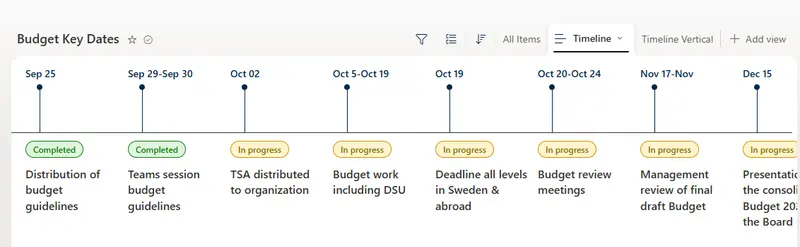
Horizontal timeline view for budget key dates and milestones with hover cards
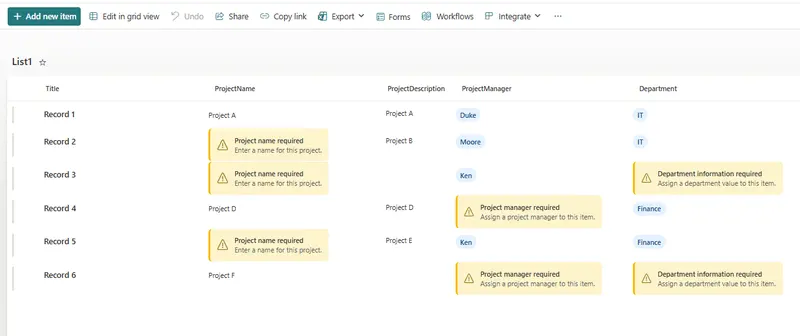
The Missing Information Callout column formatter provides a clear, accessible visual indicator when a SharePoint list column contains no value.
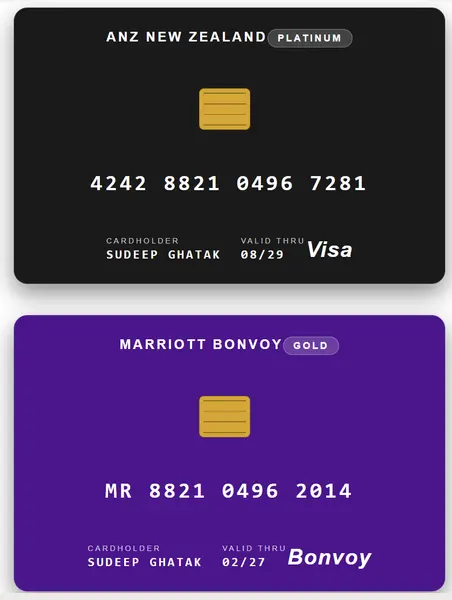
Transforms list items into realistic credit / loyalty cards with a brand name, tier pill, EMV chip, contactless symbol, embossed card number, cardholder, expiry, and network logo. The card colour is driven by the Tier value.
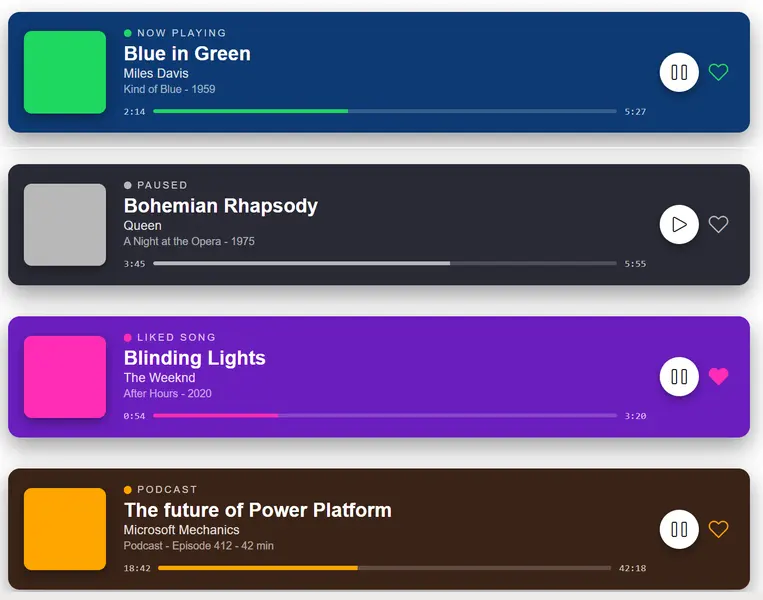
Transforms list items into Spotify-style 'now playing' cards with album-art block, status row, track / artist / album, a horizontal progress bar with elapsed and total time, and play / like controls.
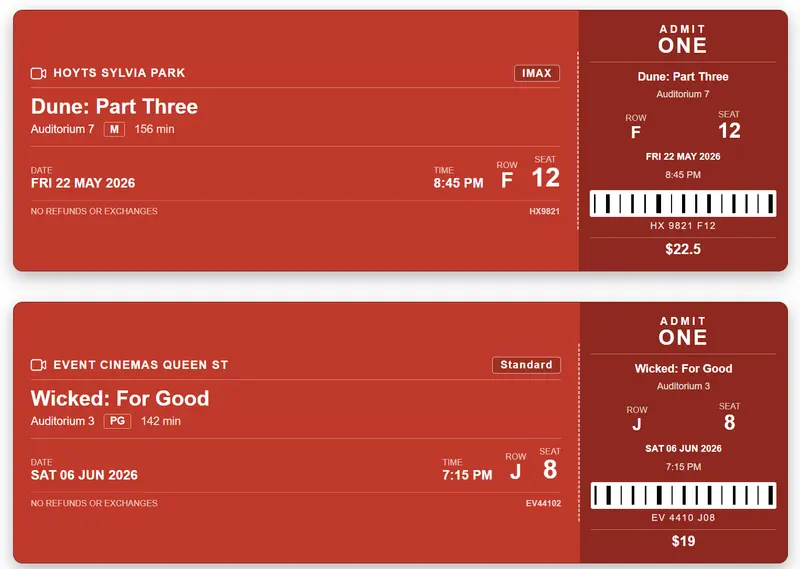
This SharePoint JSON view formatting sample transforms list items into realistic movie ticket stubs.
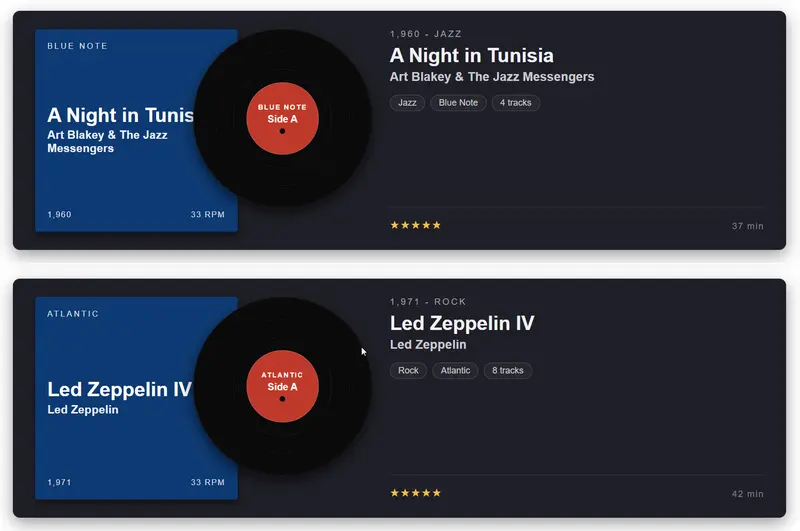
This SharePoint JSON view formatting sample transforms list items into vinyl record album cards with a sleeve, a record peeking out, and a metadata column.
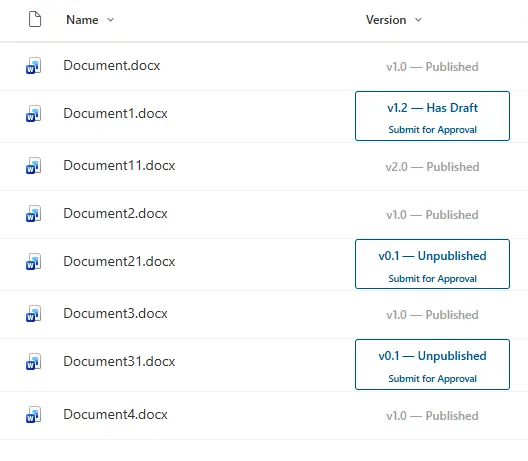
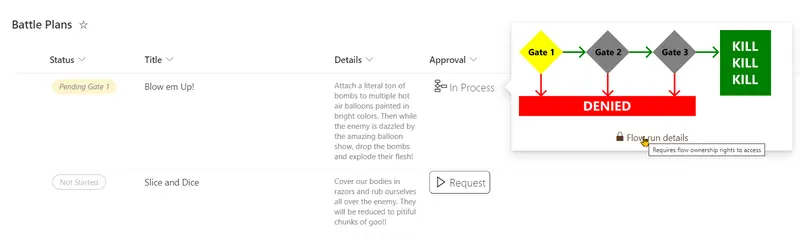
Formats the SharePoint Version column as a combined status badge and approval flow trigger. Major versions (published) display a greyed-out non-clickable card. Minor versions display version status and a Submit for Approval button that triggers a Power Automate flow.
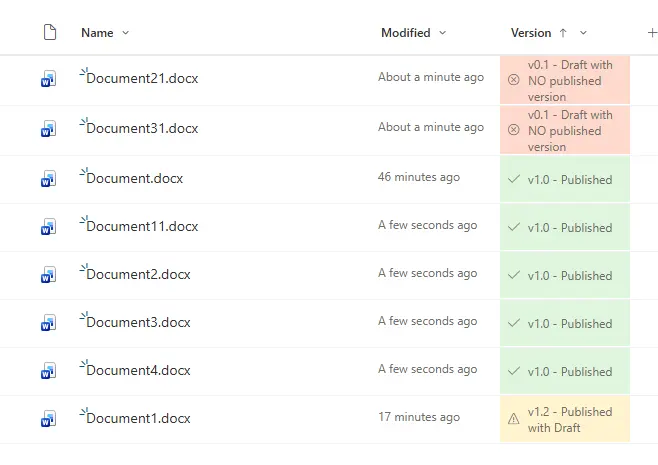
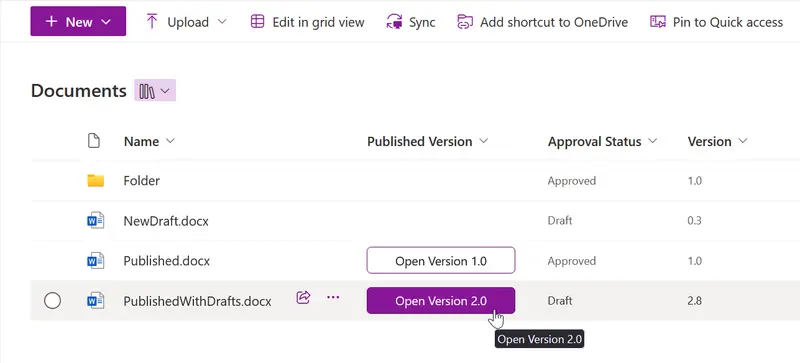
Sample contains an example of using the modulo math expression for highlighting 'published', 'published with draft' and 'draft with no published versions' of pages
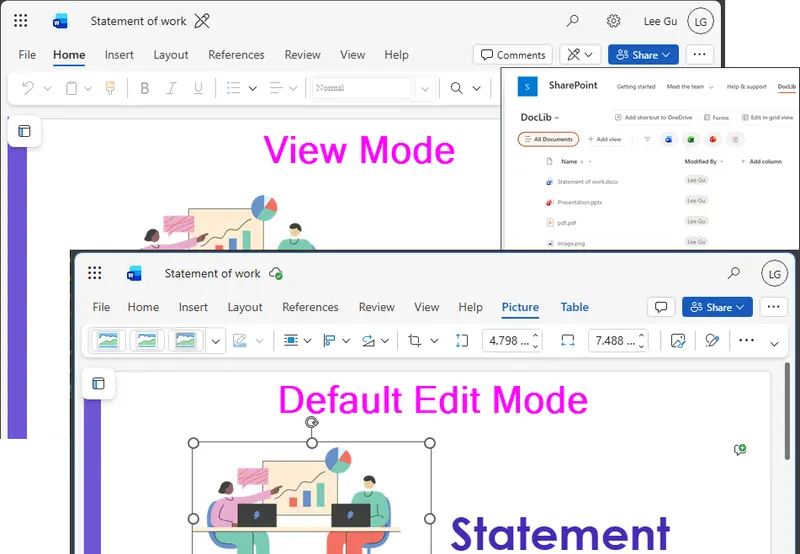
By default, office documents in a SharePoint document library open in Edit mode, switching the default open behaviour from Edit to View prevents common day-to-day issues.
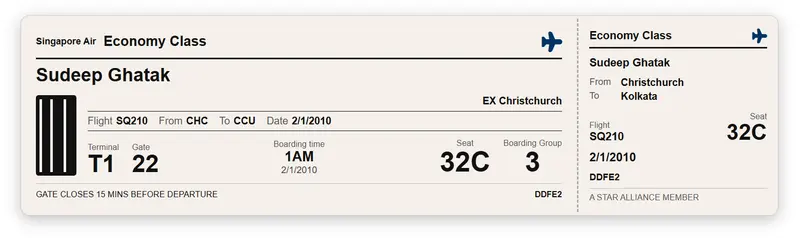
This SharePoint JSON view formatting sample transforms list items into realistic flight boarding cards.
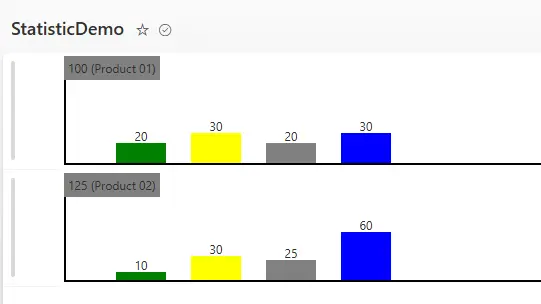
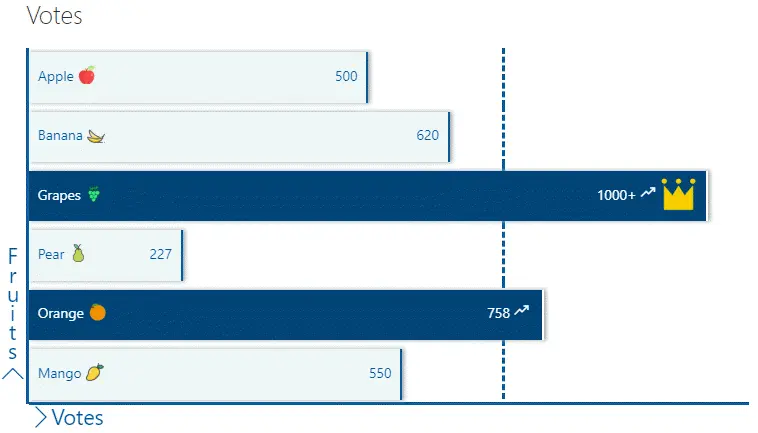
This SharePoint JSON formatting script customizes the display of a list view row by rendering a horizontal bar chart directly in the list.
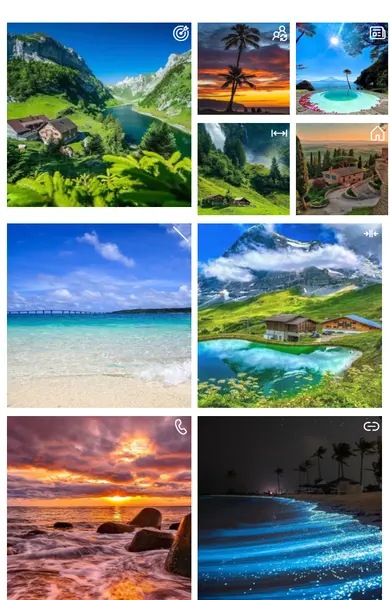
Modern tile card layout for displaying training courses with images, badges, and hover previews in SharePoint Gallery view.
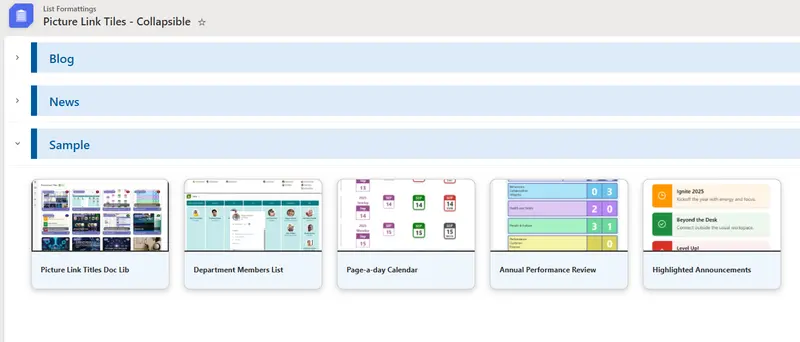
Creates a card-style tile view in a SharePoint list with expand and collapse functionality.
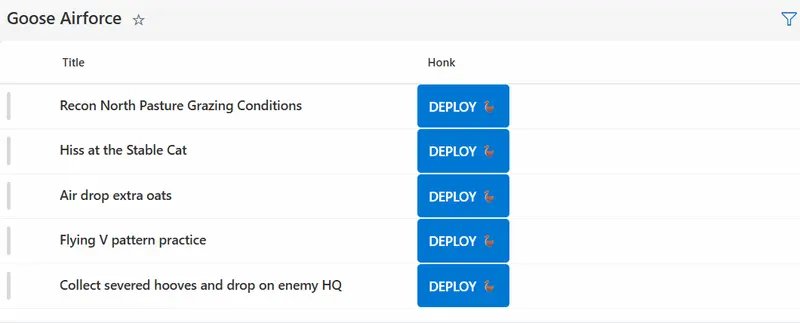
Trigger a Power Automate flow instantly with visual feedback using the embed action.
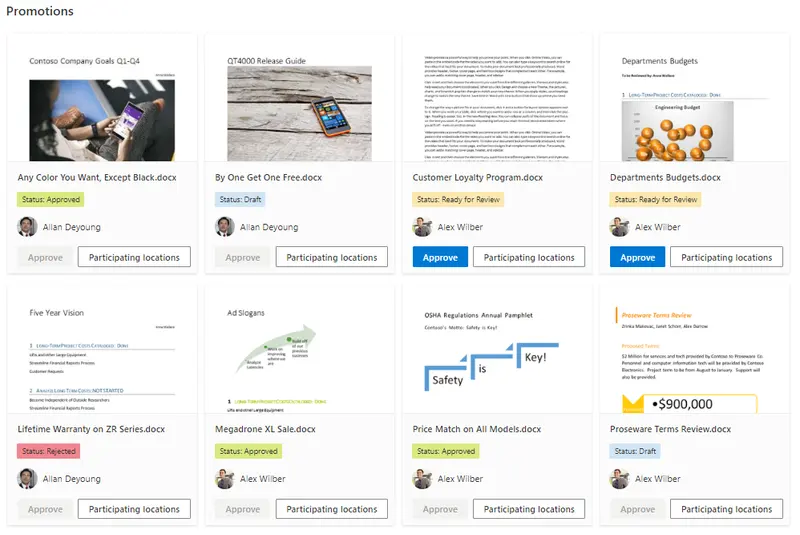
This sample uses tileProps element to create tile layout on the view. This layout allow users to see the list as the promoted links app (including the power the security trimming on the items). This sample uses the Icons from the Microsoft UI Fabric. The name of the icon is referenced through an Icon field.
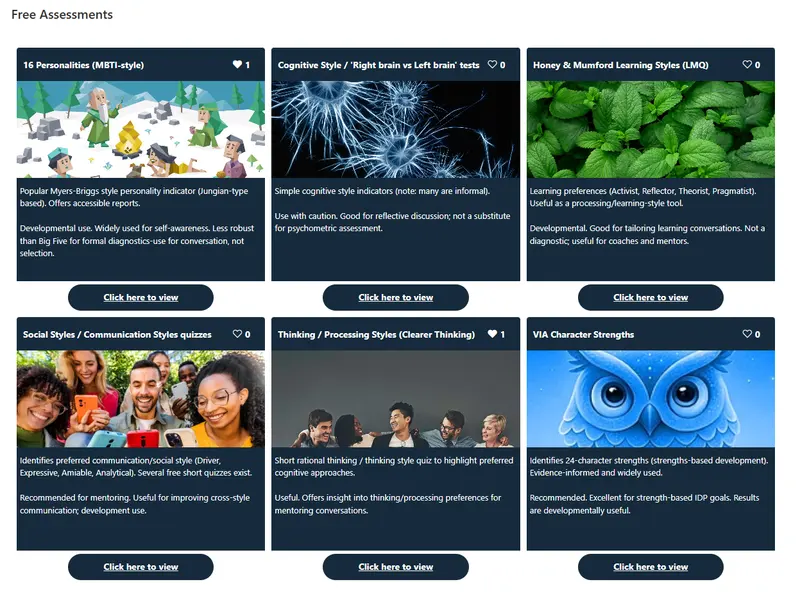
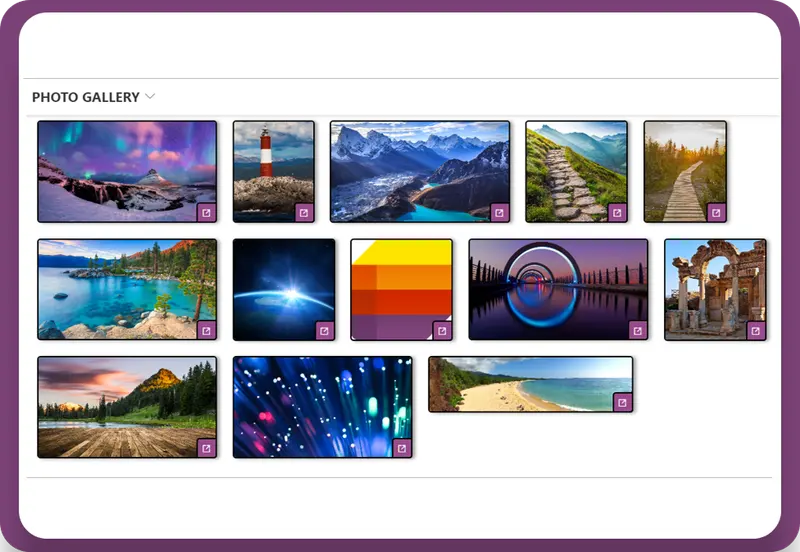
This sample demonstrates formatting a document library gallery view into a photo gallery showing title, description, hyperlink and likes.
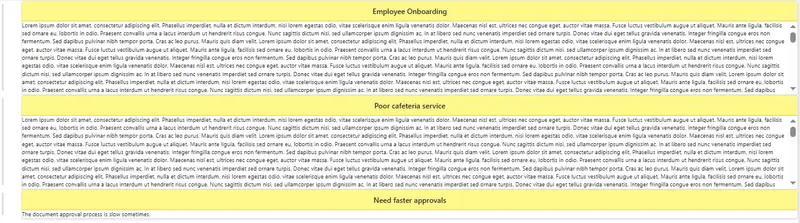
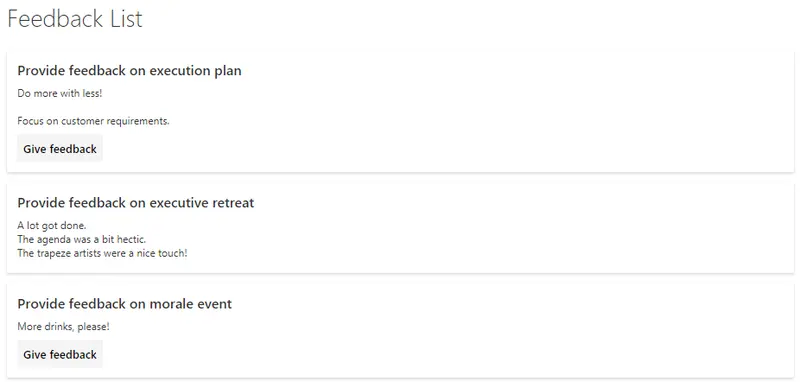
This sample uses SharePoint List Formatting to display feedback items as card-style layouts with a prominent title header and scrollable feedback content.
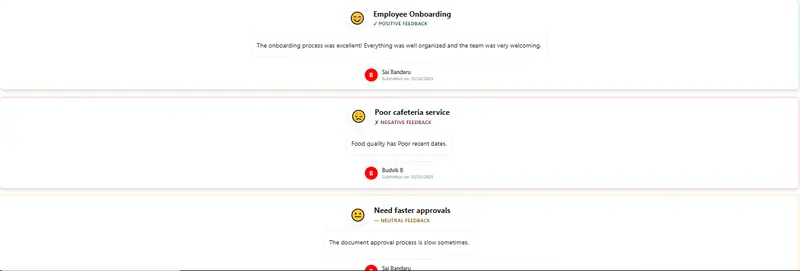
This sample uses SharePoint List Formatting to visualize feedback sentiment with keyword-based detection in a color-coded and emoji-enhanced card view.
Creates a card-style tile view in a SharePoint Document Library with file previews, badges, titles, and a footer with actions.
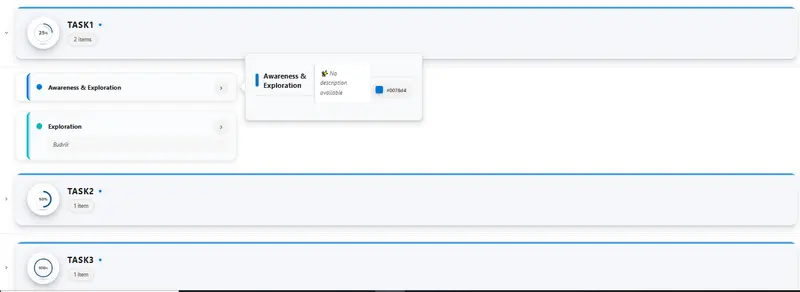
Displays grouped items as modern cards with expandable accordion headers and hoverable detail panels.
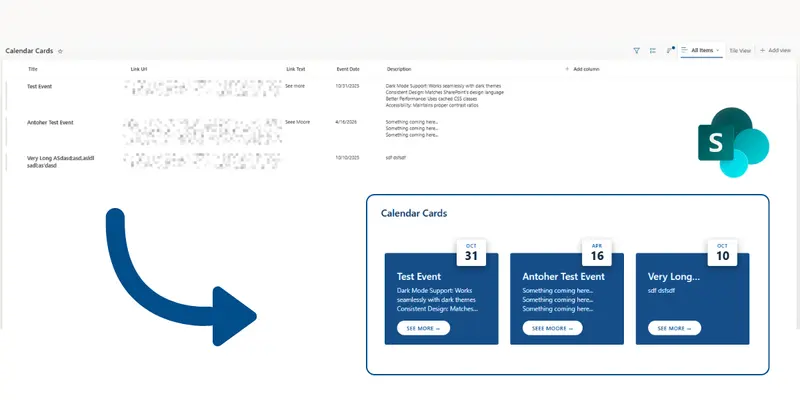
This sample turns list items into modern event cards with calendar-style date badges. Each card shows the event date with the month and day number in a nice visual format. The cards also display the event title, description, and an optional link button.
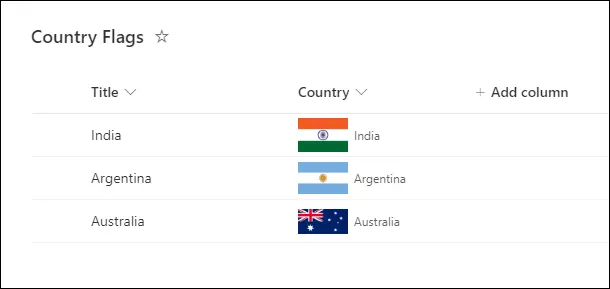
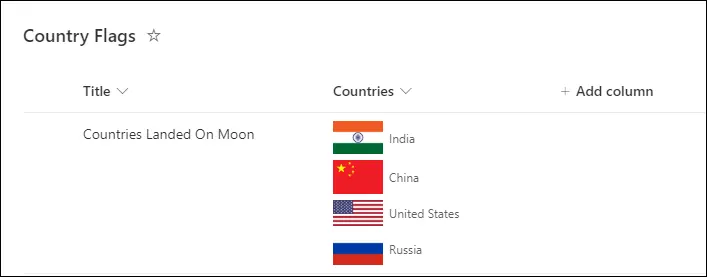
This sample demonstrates displaying the flag of the country selected in the single selection SharePoint choice column.
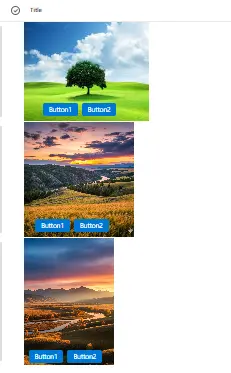
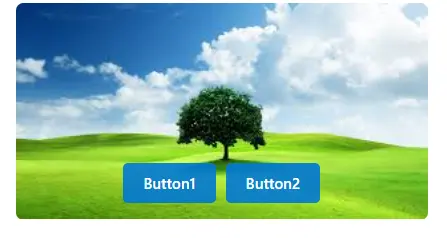
This column formatting sample displays images with action buttons overlaid at the bottom, with dynamic sizing based on image orientation.
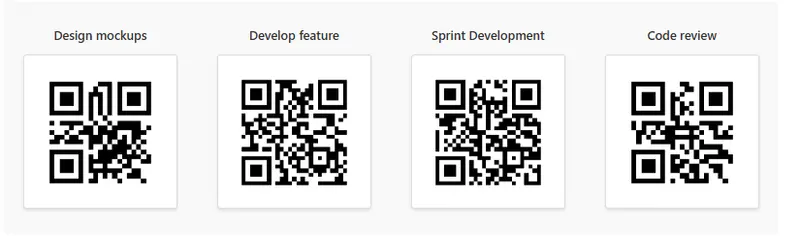
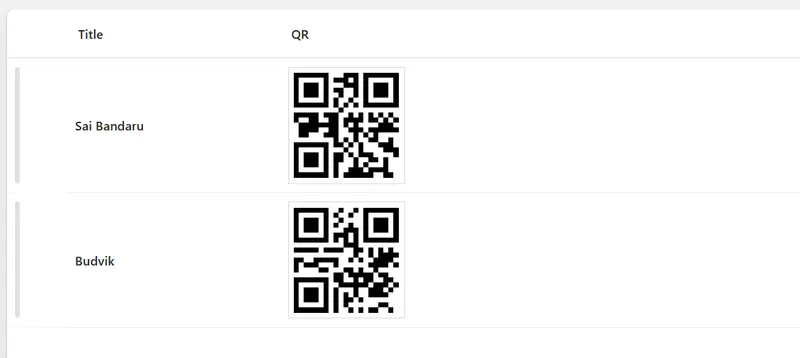
This sample uses SharePoint List Formatting to automatically generate QR codes for each list item in a tile view based on the Title field.
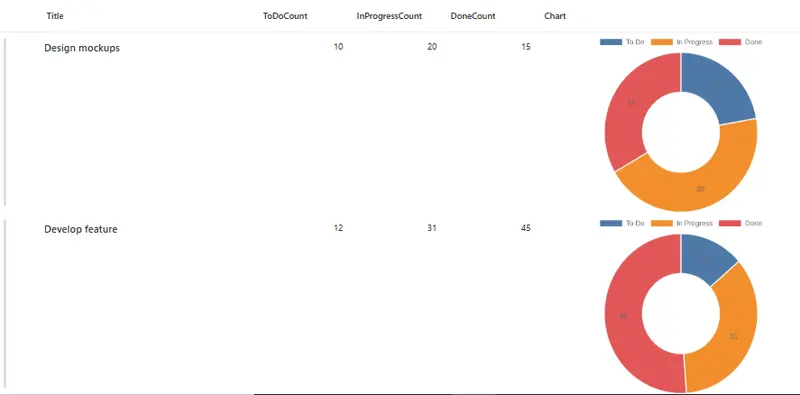
This sample uses SharePoint column formatting to automatically generate multiple chart types (pie, doughnut, out-labeled pie, and polar area) visualizing task status distribution across To Do, In Progress, and Done states.
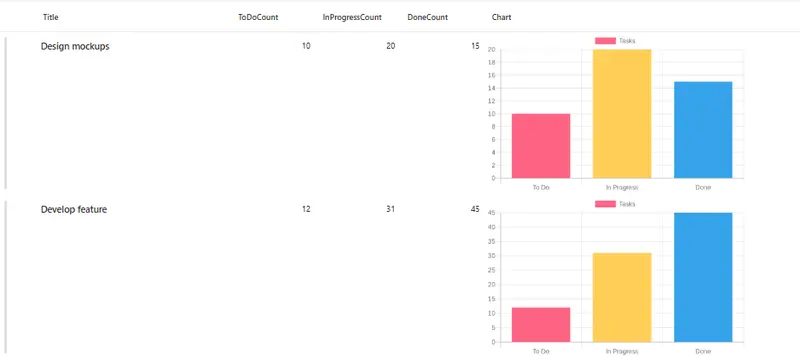
This sample uses SharePoint column formatting to automatically generate bar charts visualizing task status distribution across To Do, In Progress, and Done states.
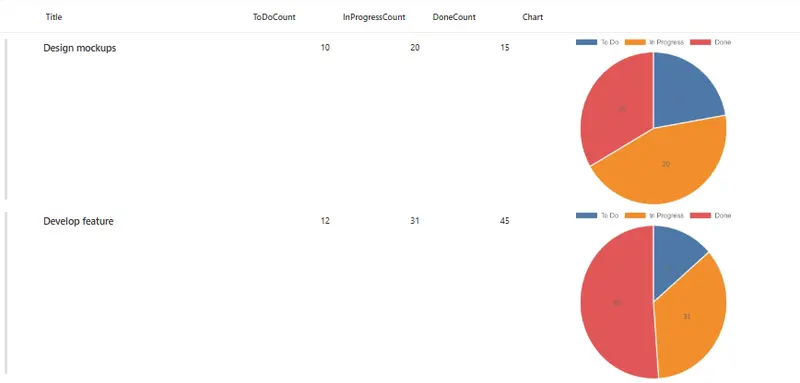
This sample uses SharePoint column formatting to automatically generate pie charts visualizing task status distribution across To Do, In Progress, and Done states.
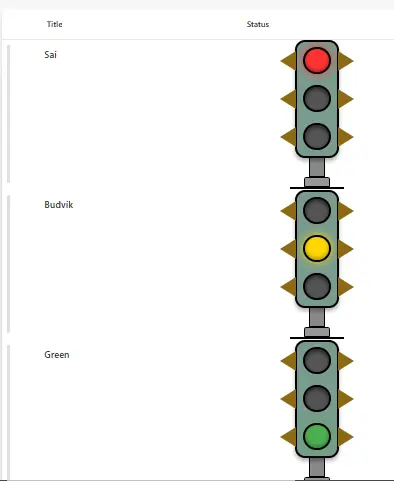
This sample demonstrates how to use SharePoint Column Formatting to display a realistic traffic light visual indicator based on status values.
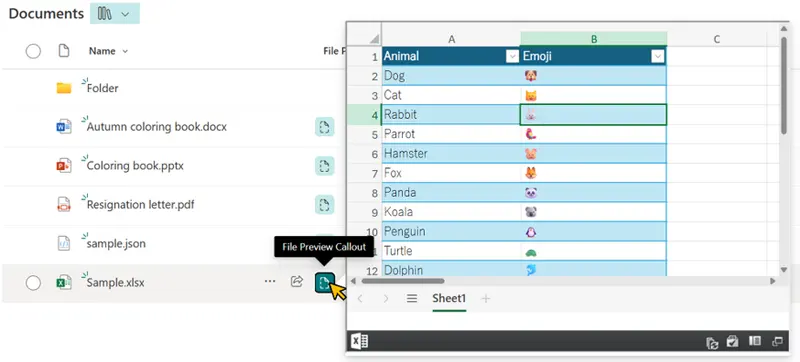
This sample demonstrates how to display a file preview from a document library or Site Pages inside a callout using the embed action. This allows users to view file contents without leaving the current page.
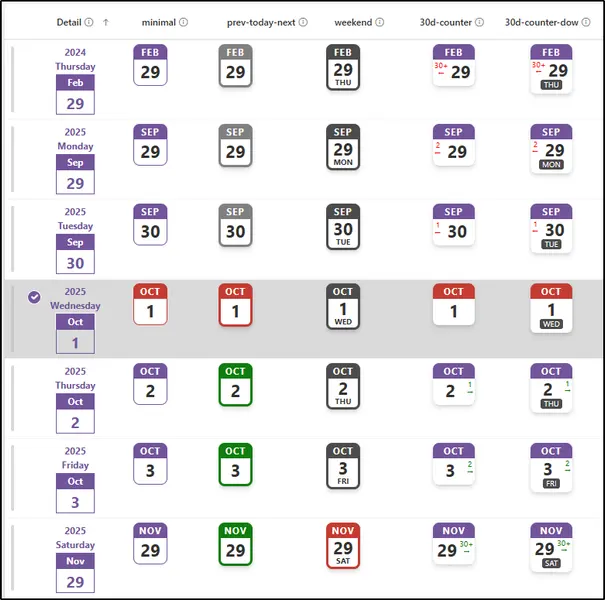
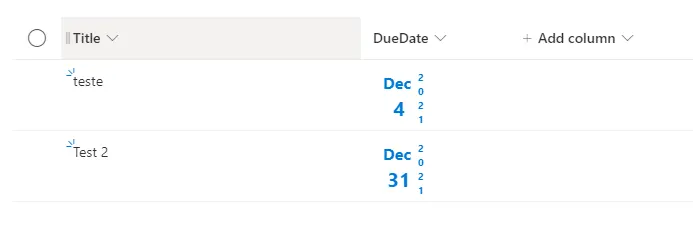
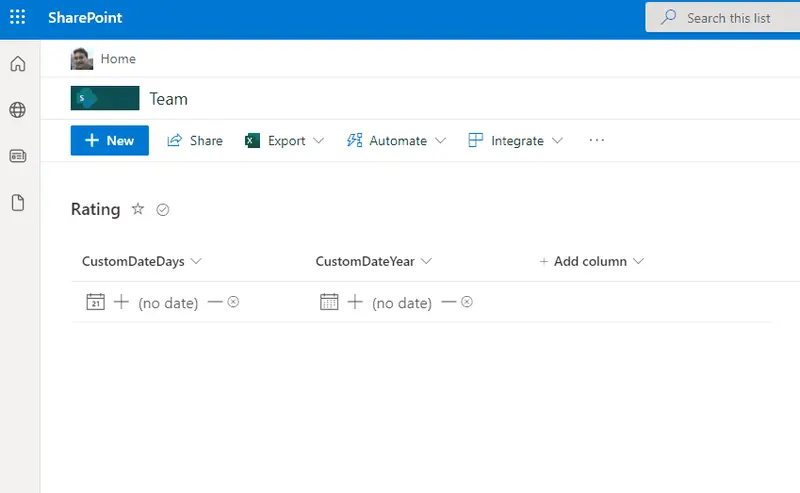
This sample customizes a date column to look like a page-a-day calendar. It does this by using the date part functions (`getDate`, `getMonth`, and `getYear`).
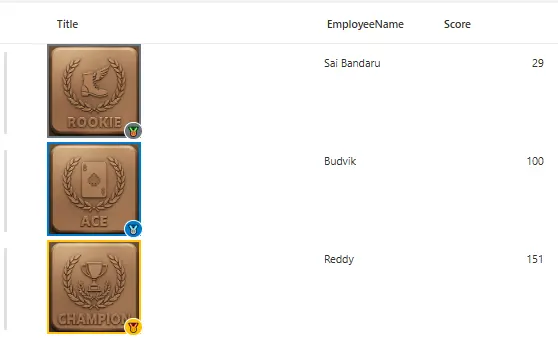
This sample demonstrates how to create dynamic Gamification badges in SharePoint columns based on score values with visual indicators and tooltips.
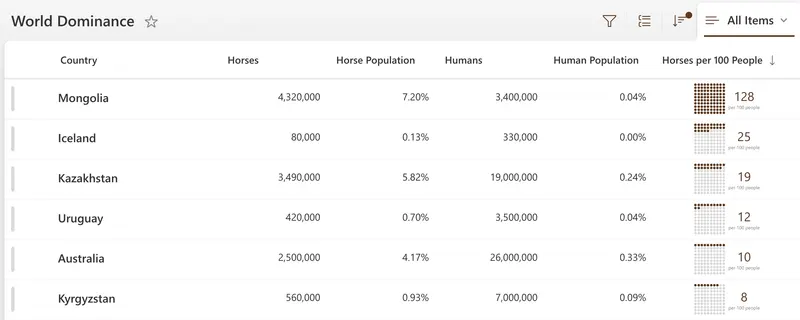
This sample demonstrates displaying a grid of 100 dots where dots are colored based on how many of something per 100 people.
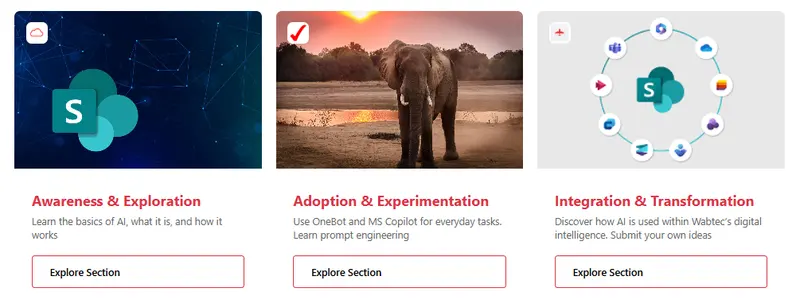
This sample uses SharePoint List Formatting to display list items as modern card tiles with image header, icon overlay, and call-to-action button.
This sample demonstrates how to dynamically add colored pills to lookup columns.
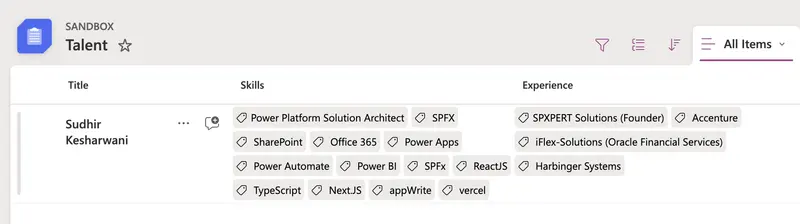
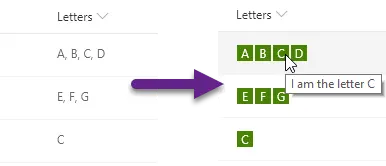
This sample demonstrates using the split function to display a comma separated text as tags.
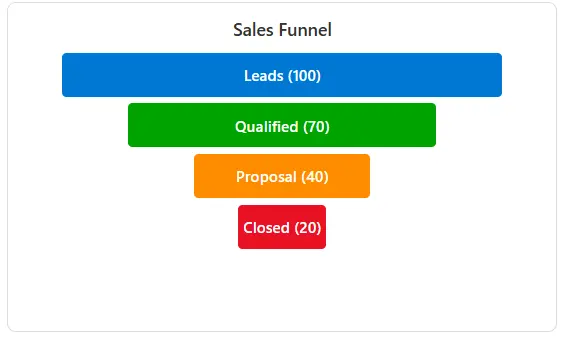
This sample displays funnel chart stages in a modern dashboard-style tile card with proportional widths and customizable colors.
This sample displays images with action buttons overlaid on the bottom of each image in a compact tile format.
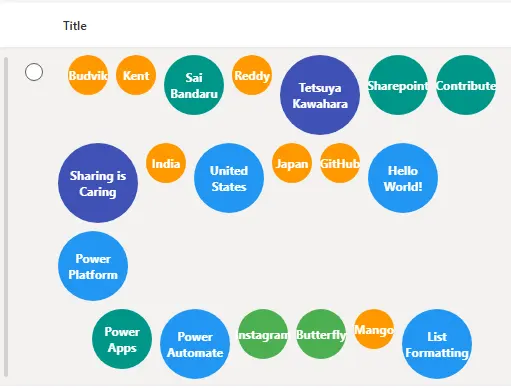
This sample demonstrates how to use SharePoint Column Formatting to generate a dynamic bubble chart for list items.
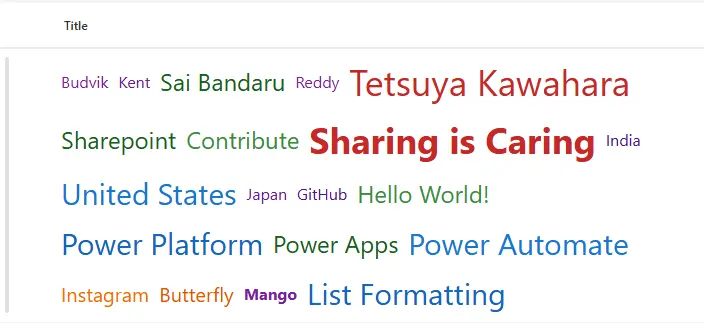
This sample demonstrates how to use SharePoint Column Formatting to generate a dynamic word cloud for list items.
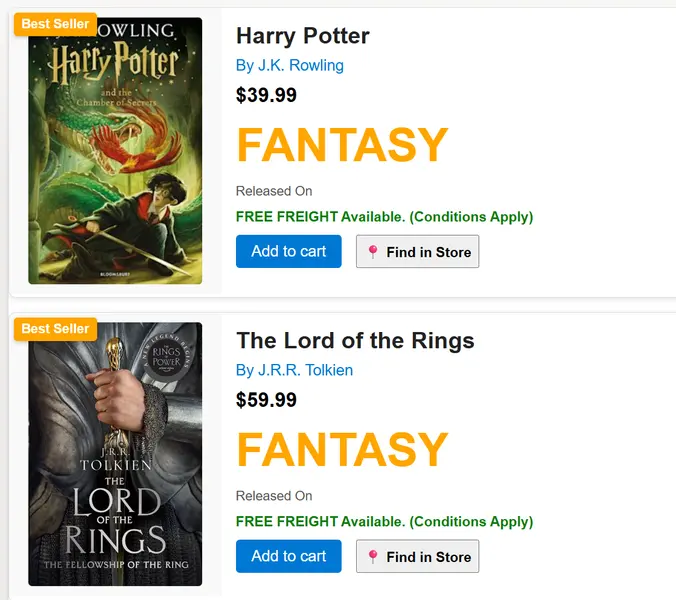
This SharePoint JSON view formatting sample transforms your list items into visually rich book cards.
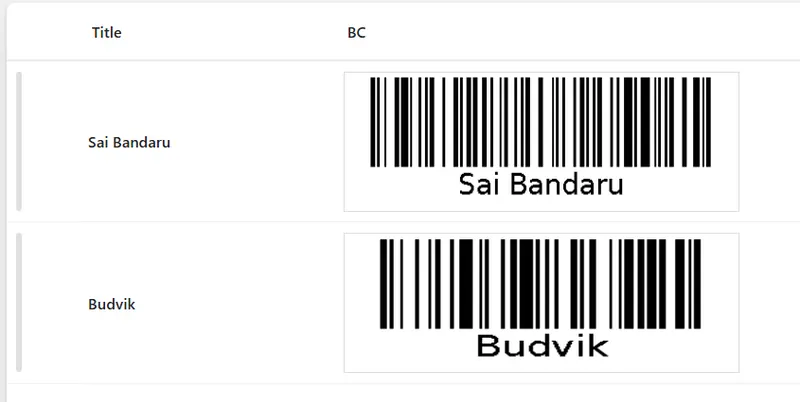
This sample uses SharePoint List Formatting to automatically generate Bar code for each list item based on the Title field.
This sample uses SharePoint List Formatting to automatically generate QR codes for each list item based on the Title field.
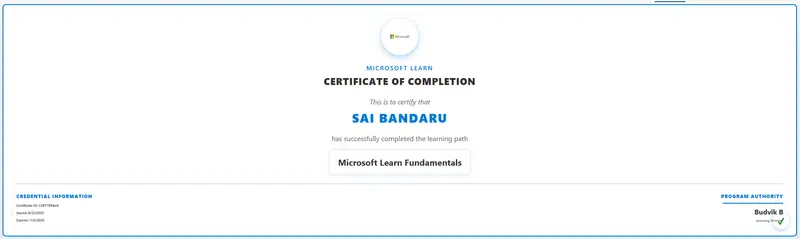
This sample uses SharePoint List Formatting to display certificate data as a card list view.
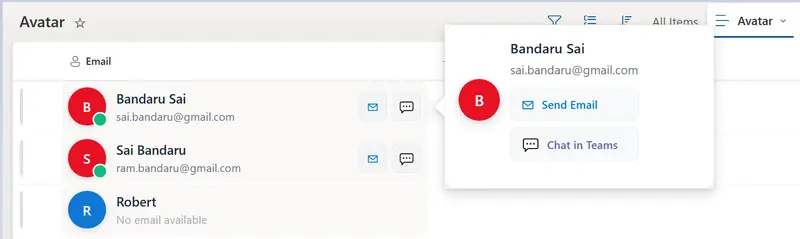
This sample uses SharePoint List Formatting to display Contact Custom Avatar data as a Card view.
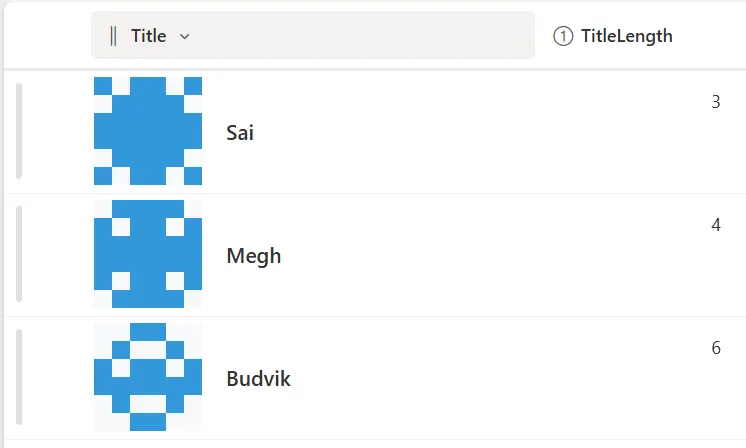
This sample demonstrates how to use SharePoint Column Formatting to generate Identicons for list items.
This SharePoint column formatting sample provides a modern, interactive People card for list items using JSON formatting.
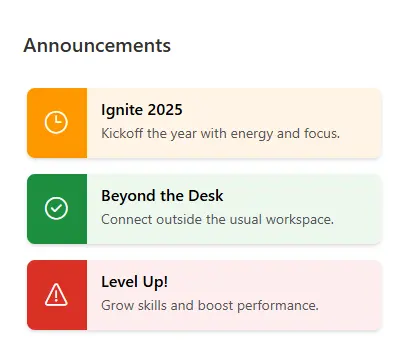
A list formatting style that visually emphasizes important announcements.
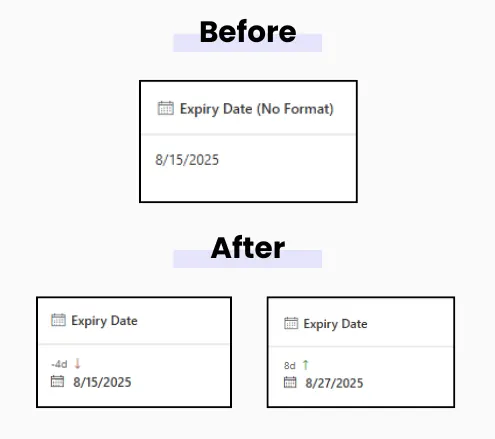
This sample shows how many days are left until a date or how many days have passed since a date, right inside a SharePoint list column. Color-coded for quick scanning.
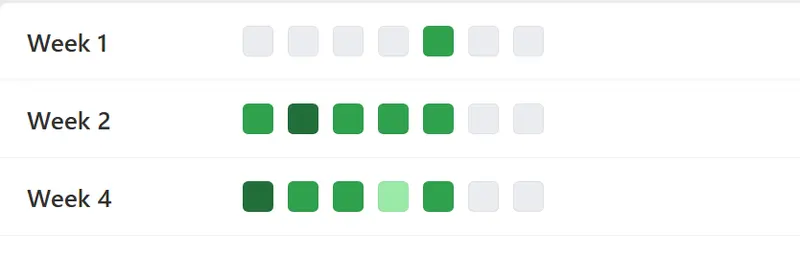
This sample uses SharePoint List Formatting to display weekly data as a heatmap calendar view.
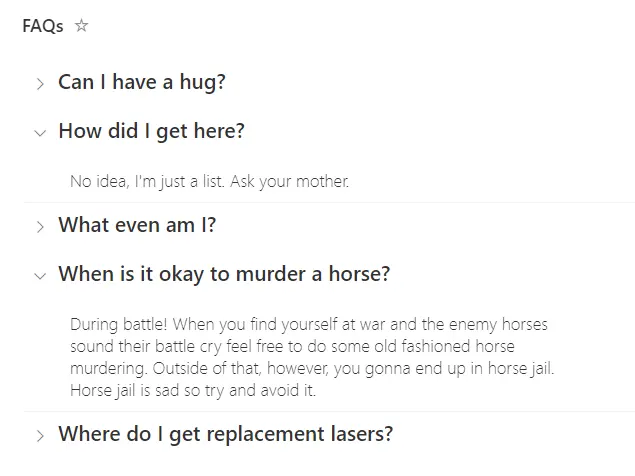
This sample uses standard group rendering to provide a list of expandable questions.
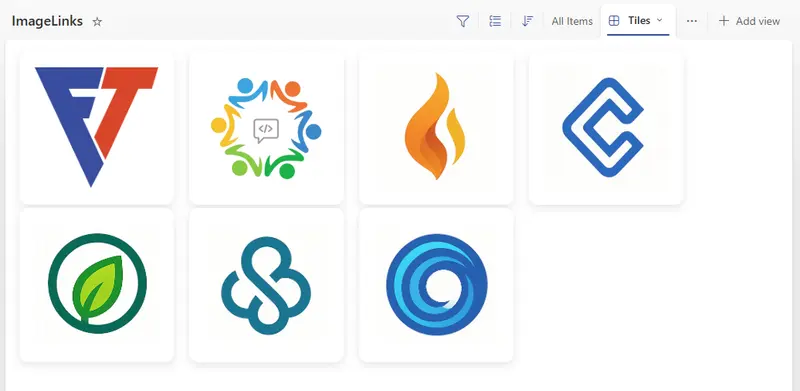
This sample shows images in a tile layout using SharePoint's Gallery view. Each image tile is clickable and opens a link from another column.
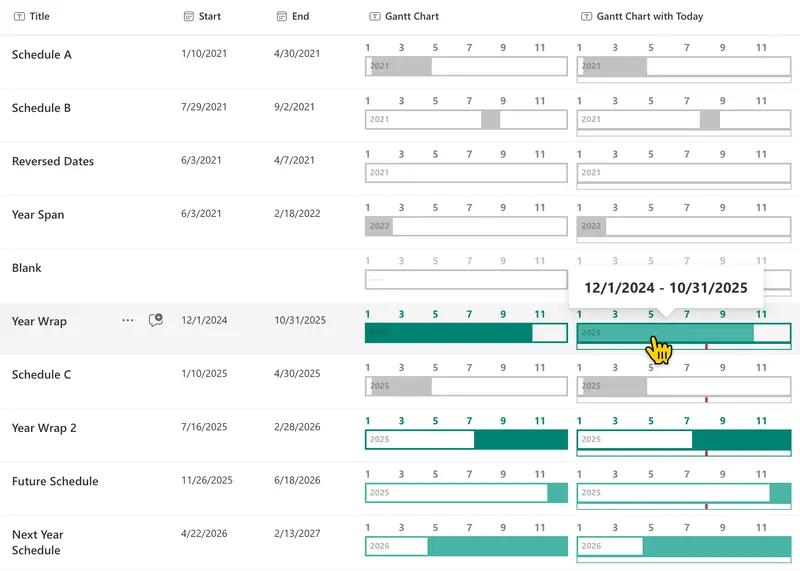
This sample demonstrates the display of a yearly Gantt chart.
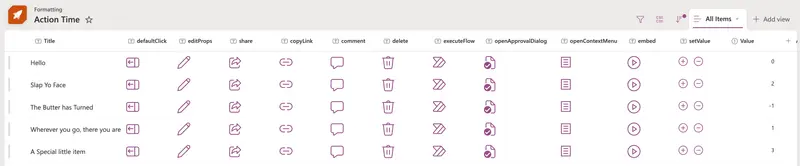
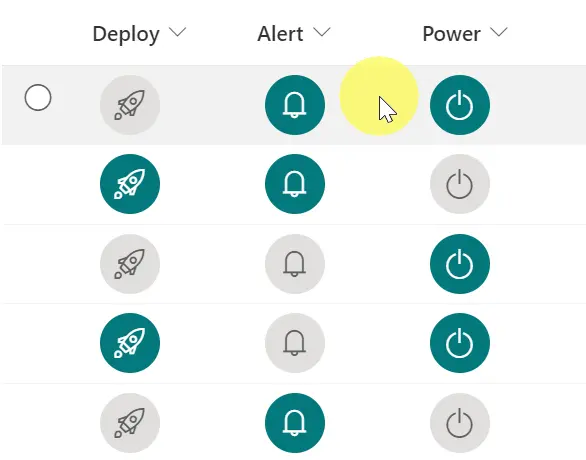
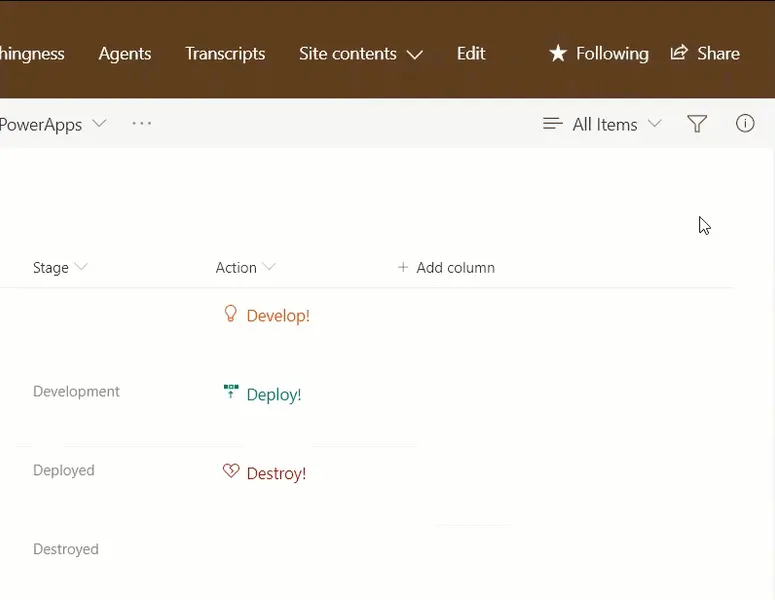
You can use column and view formatting to create buttons that perform pre-defined actions when clicked. This sample provides a quick format that demonstrates the use of each of the possible actions.
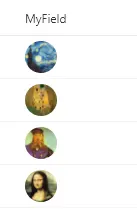
This sample includes two formats to display images in Lists as grid - row formatter and tile formatter for Gallery view.
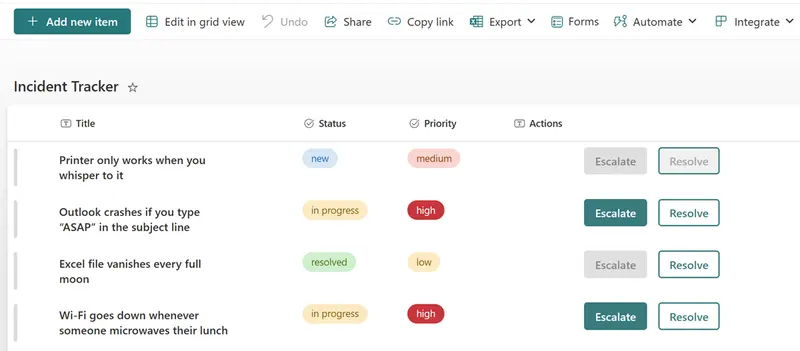
Adds Escalate and Resolve buttons to incident lists using column formatting and executeFlow.
This sample demonstrates changing managed metadata (multiple) values to buttons that open (external) sites, documents or items on other links.
Creating custom bookmarks for SharePoint page.
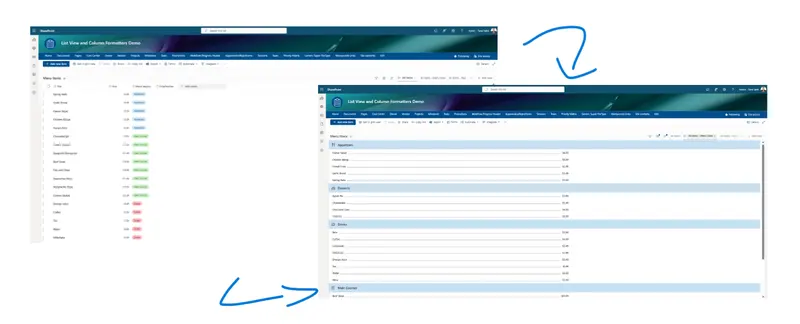
This sample transforms SharePoint list items into a styled menu layout using list view formatting.
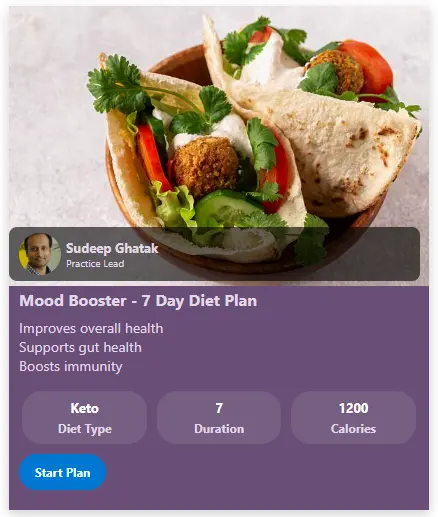
This SharePoint JSON view formatting sample transforms your list items into rich, visually appealing diet plan cards.
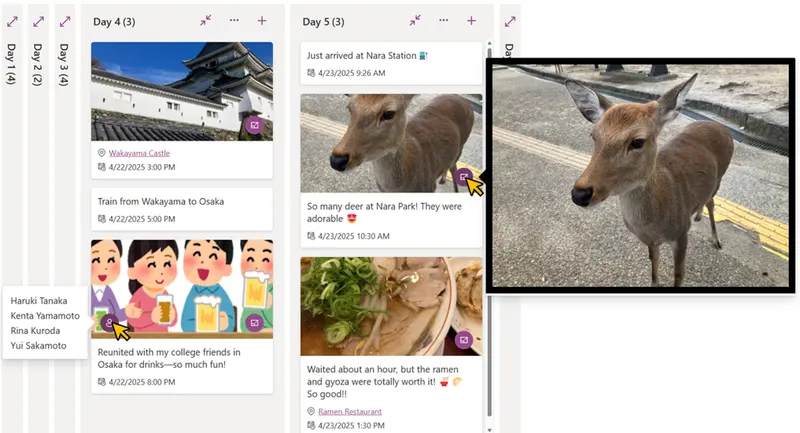
This sample demonstrates using the board view to display travel tweets in a timeline format. Each tweet supports one image and one map link.
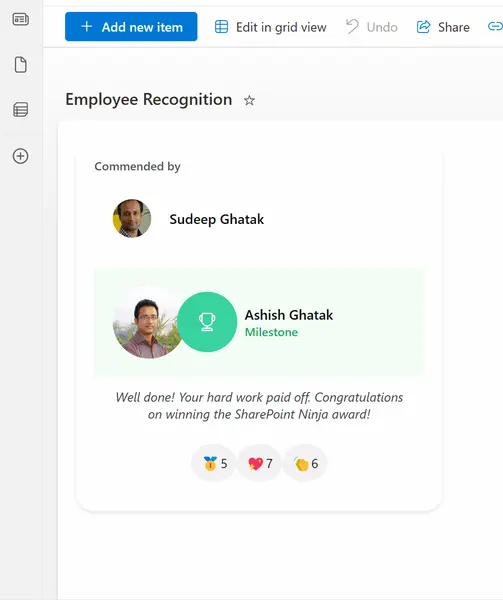
This sample acts as a digital shout-out board for your team, built right into SharePoint. It gives employees an easy way to recognize and appreciate each other's hard work. Colleagues can show their support by clicking on emojis to cast their votes.
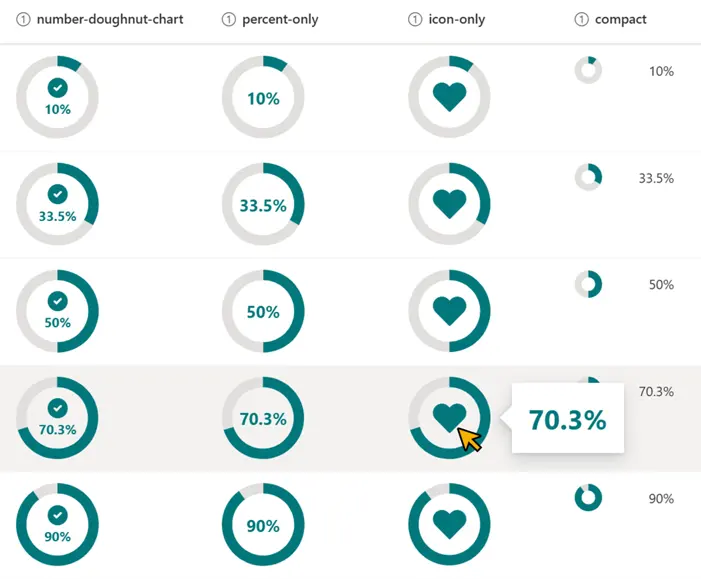
Changes the appearance of the values in number columns (percent) to a donut chart.
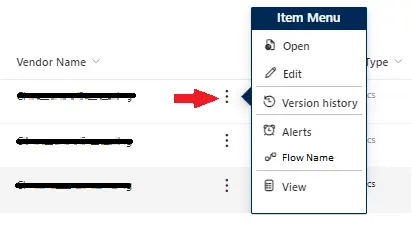
The sample is a simple version of the current context menu. It allows you to customize the menu options and link to the most user of visited links. You can add links to Flows, web pages, or other items specific the the item it is on.
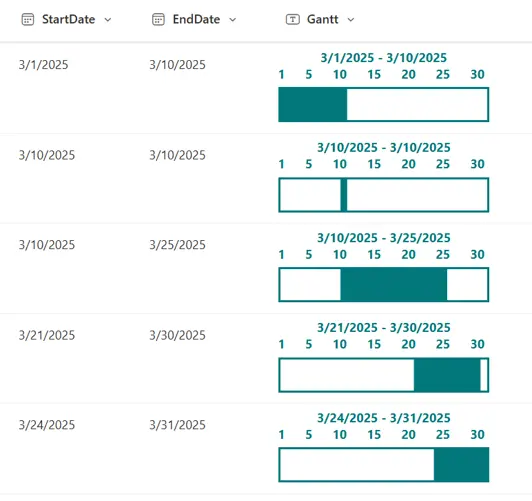
This sample demonstrates the display of a monthly Gantt chart. The Gantt chart for the month corresponding to the StartDate value will be shown.
This sample transforms list items into a template that displates quotes from People with a link to their Twitter (X) handle.
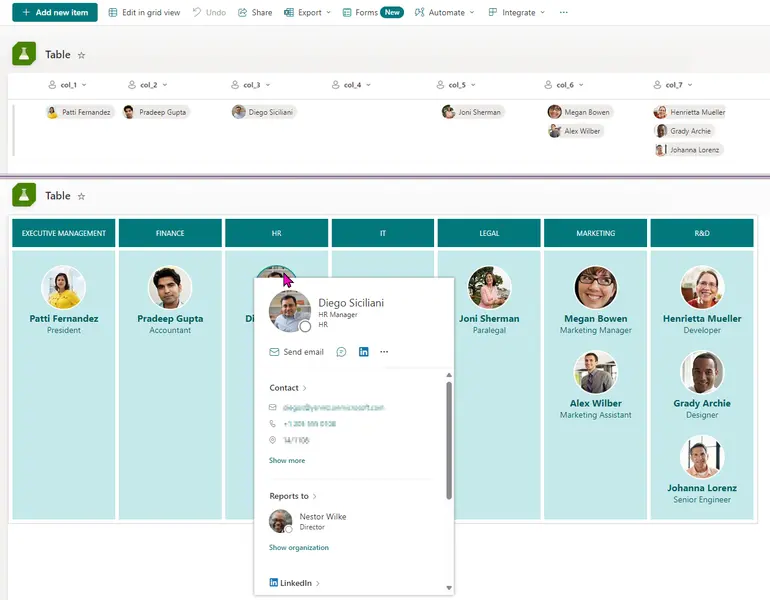
Turn list items into a custom table
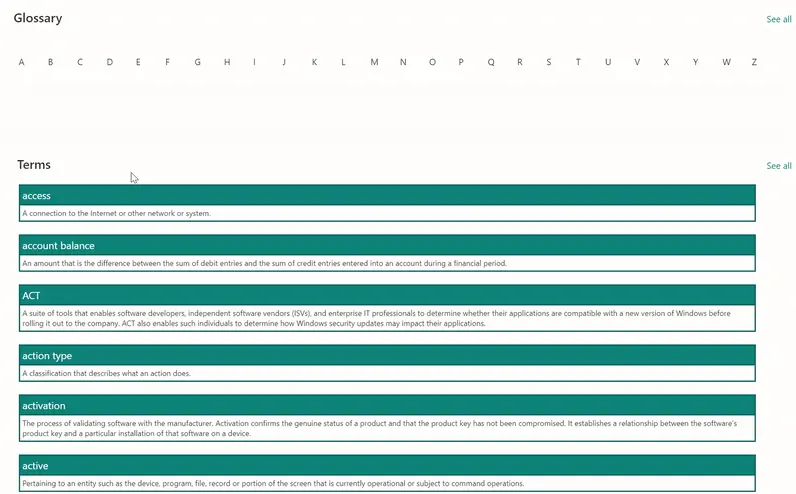
View formatters to buid a glossary page using connected list WebParts.
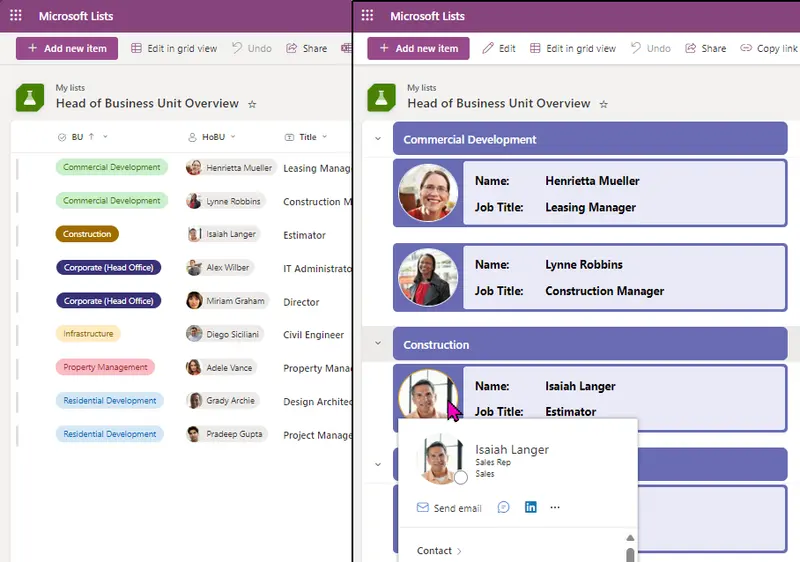
A visually appealing overview of business unit leaders to display key information at a glance.
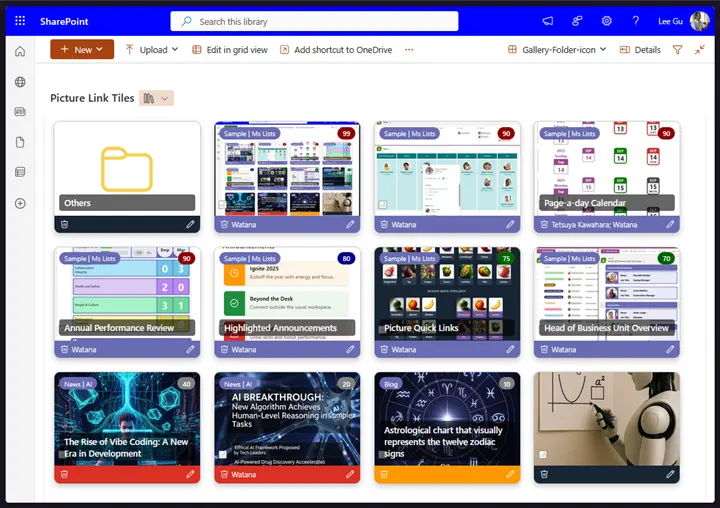
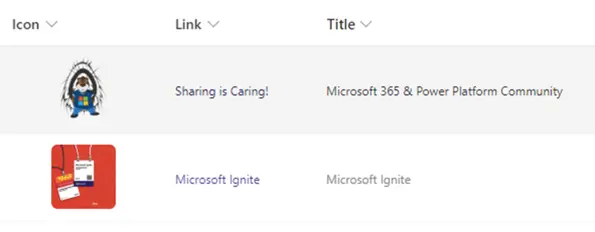
This sample demonstrates a link collection using picture and is a customization of the Gallery layout. Additionally, this sample combines group customization with a tile format.
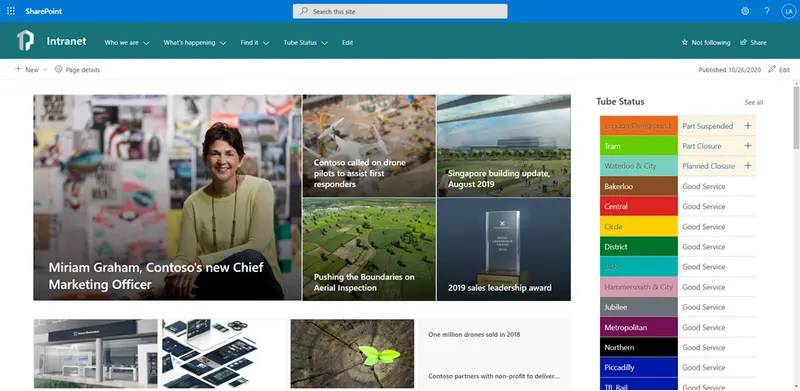
Display on the homepage of your SharePoint intranet a continually updated feed of London Underground line statuses using the publicly available Transport for London (TFL) API.
This sample displays a formatted card in a board view that enables tagging, updating card dates, menu options to reorder cards within their category, sharing links, flag (focus colors), assigning a user, and minimizing/expanding the card. This List format also uses embedded action to open custom Power Apps with parameters for digital signature of user and report generator.
If you click on an image in a SharePoint list, the image is displayed as a preview. This formatter changes the standard behavior in which a link from another column is used. In this way, a click on the image has the same behavior as if the link had been clicked directly.
This JSON sample demonstrates how you can format the work progress category choices as pills found in the newly released Microsoft Lists Work progress tracker template.
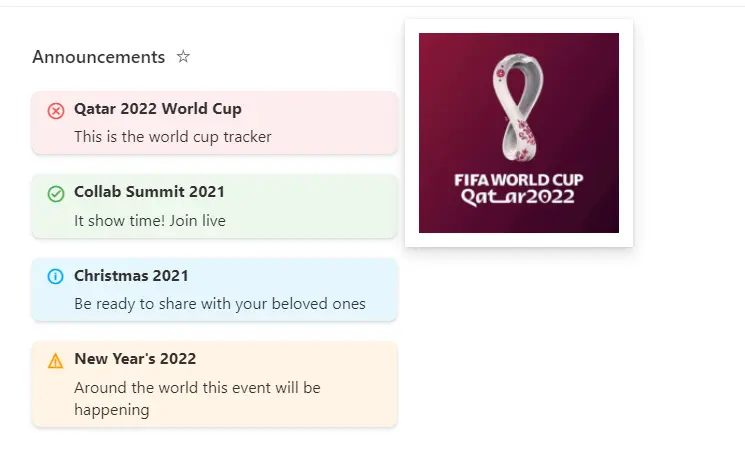
This sample formats your view to look like a Announcements card with a similiar style to Viva Connection Cards when on a SharePoint Page. In Microsoft Lists it will also show an image that you can connect with the Announcement.
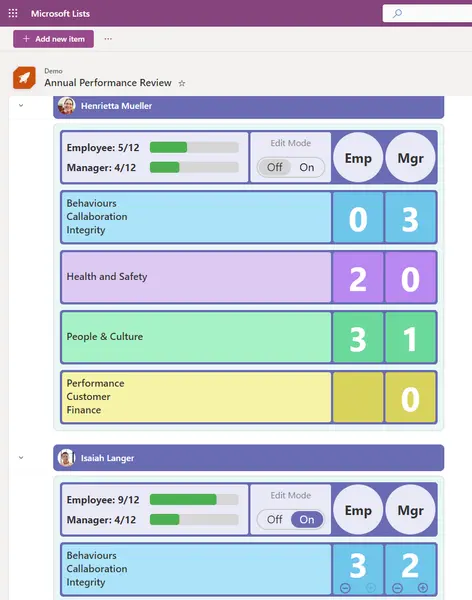
This sample demonstrates how to change row data to column format for annual performance review form.
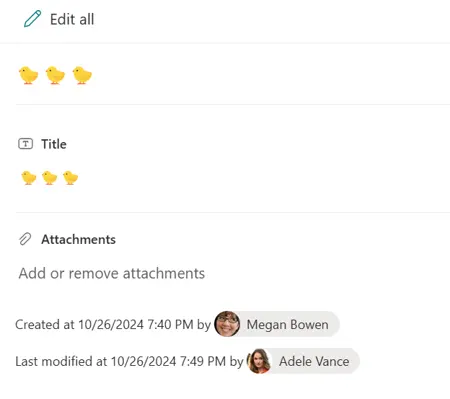
This sample demonstrates displaying the values of Created, Created By, Modified, and Modified By in the footer of the form.
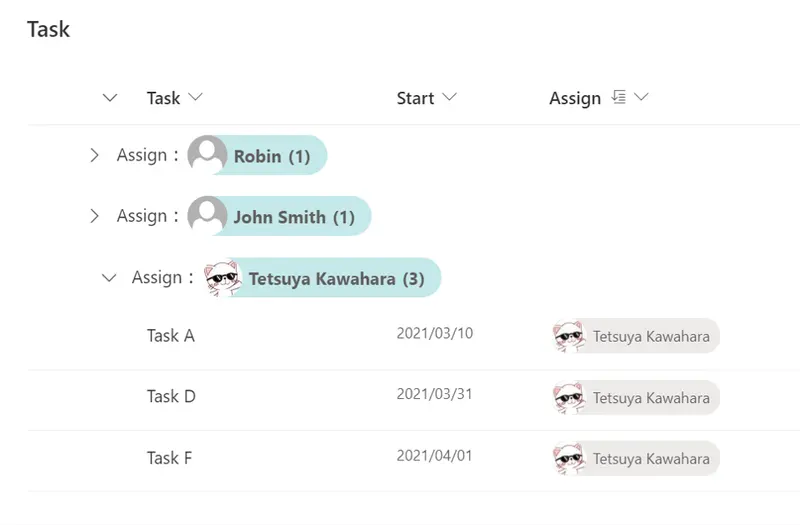
This is a sample of customizing the group header when grouping by user column. Display the user's picture as well as the user's name in the group header.
This is a sample that enables you to show content of various columns (single line of text, person) in a modern card design. It also shows two buttons that can call Power Automate flows for actions like sending emails or scheduling meetings.
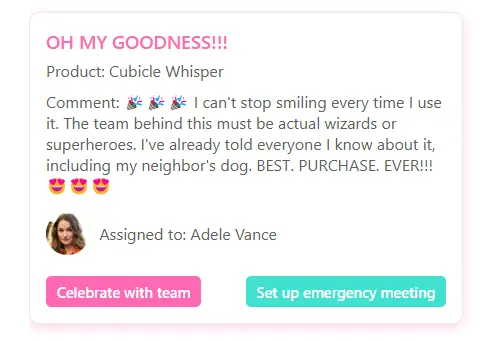
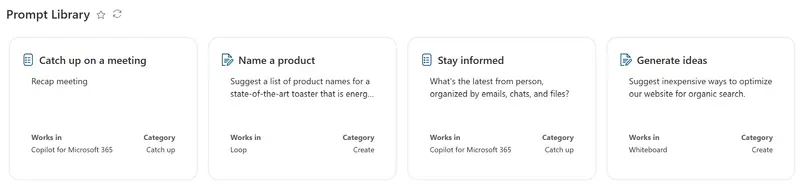
This sample demonstrates how to format list items as prompt cards
This formats applies different SVGs with multiple paths to a number field, depending on the value of the field.
This sample creates a button for opening the currently published version of a document.
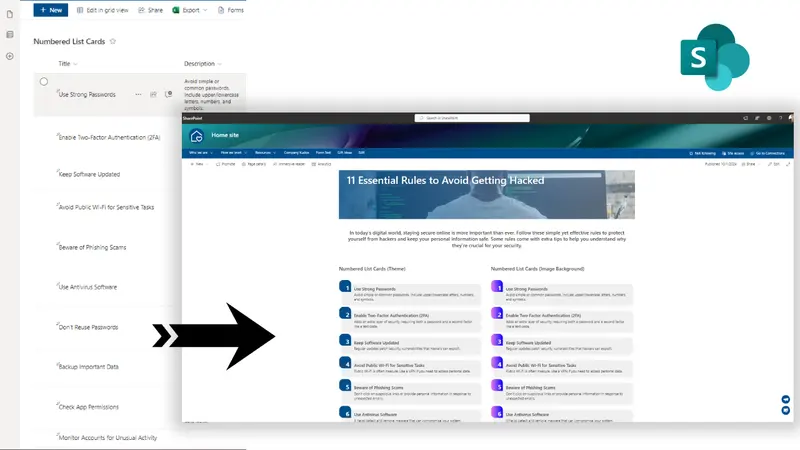
This sample converts list items into numbered list cards. The numbering is done using @rowIndex JSON formatting value.
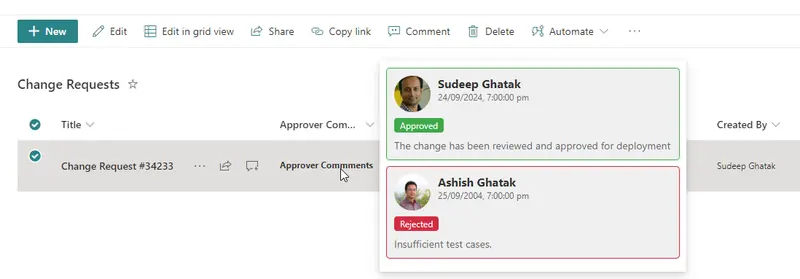
The approval hover card provides an intuitive, streamlined way for users to quickly access key details about an approval details without navigating away from their current task or screen.
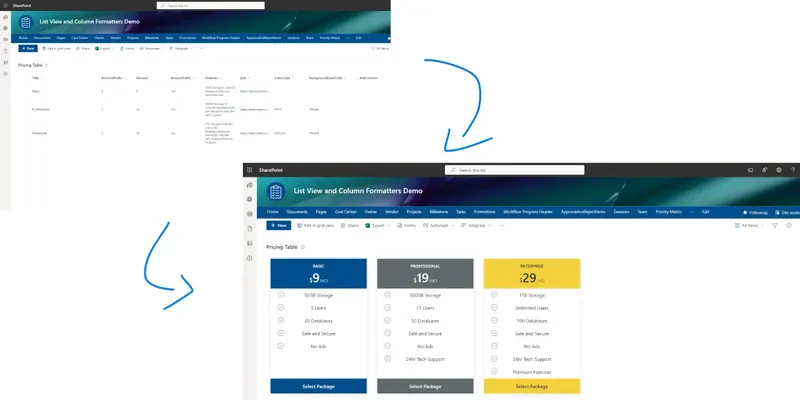
This sample transforms list items into cards formatted with pricing table layouts.
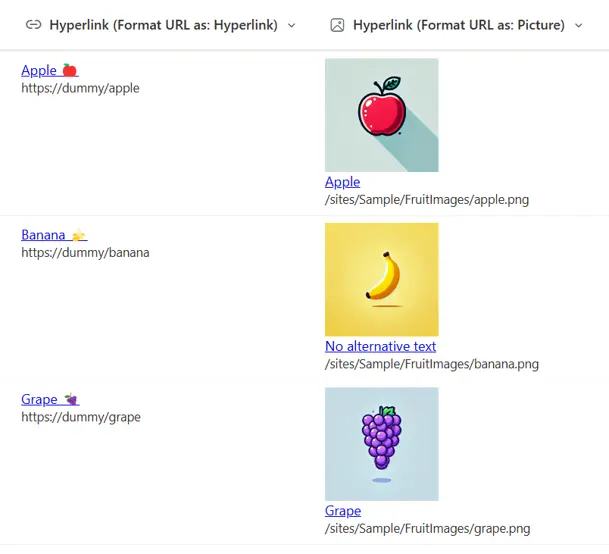
This sample demonstrates displaying a URL in a hyperlink column.
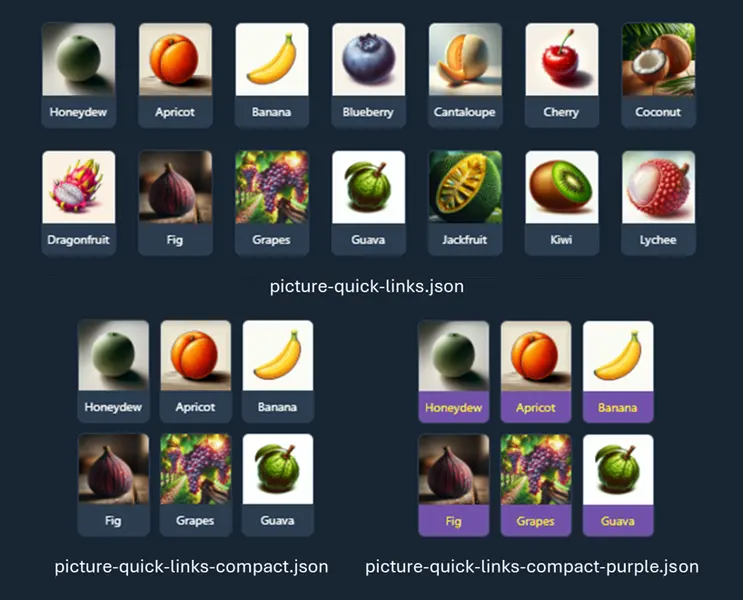
This sample shows custom quick links for adding to a vertical section in a SharePoint page.
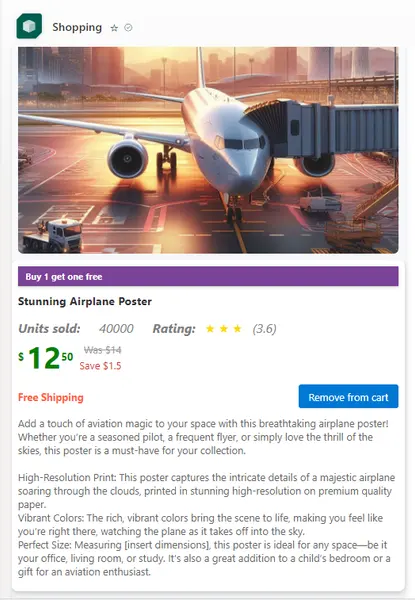
The JSON template is designed for an online shopping cart. It displays items within the cart, including product details, pricing, shipping information, and user interactions like adding or removing items.
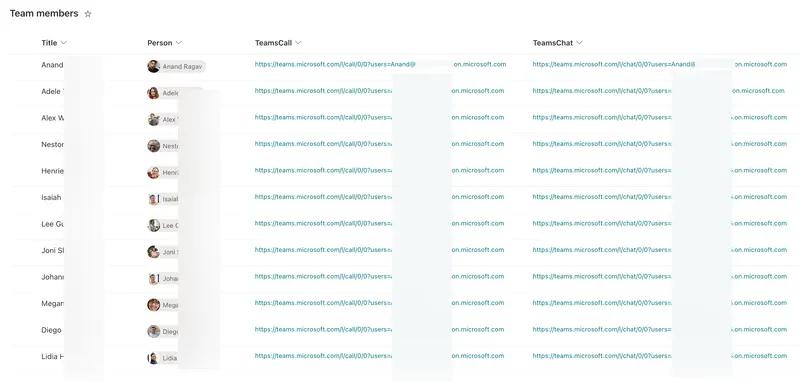
This sample creates a speed dial list for your team members/contacts, that you can list as a tab in your teams channel and/or display on your Team SharePoint site, to get quick access to your contacts through Teams call, chat and email.
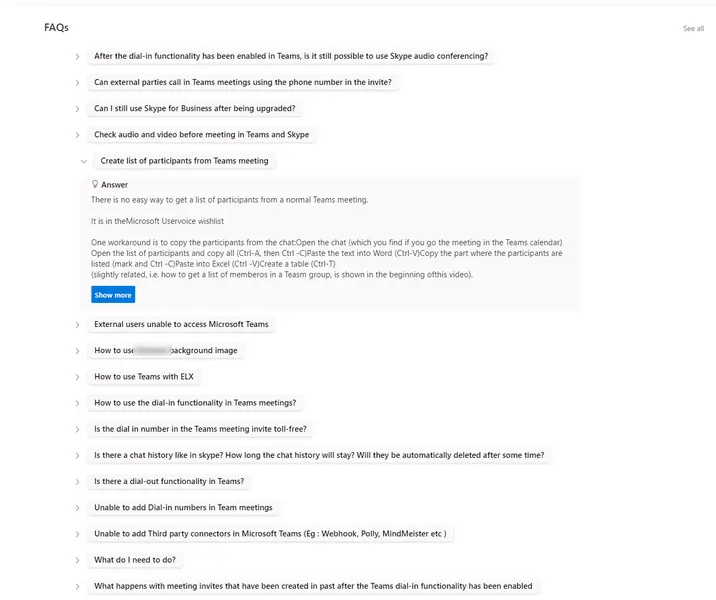
This sample formats your view to appear and work like an Accordion style FAQ (Frequently Asked Questions).
This sample demonstrates the side-by-side display and comparison of the current time in different countries around the world.
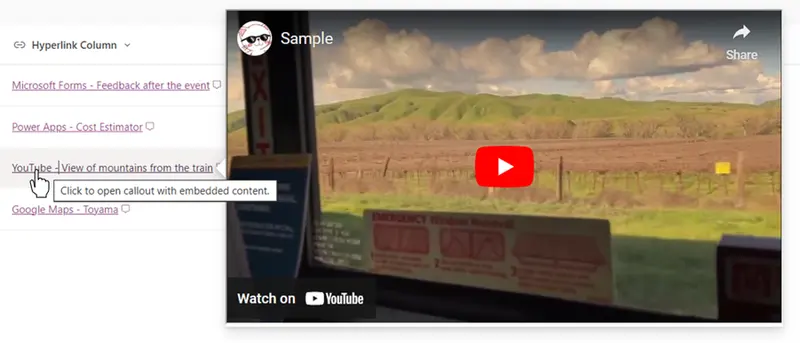
This sample demonstrates displaying embedded content using the embed action.
This sample demonstrates the use of the setValue action of customRowAction to set the current logged-in user in the Person column.
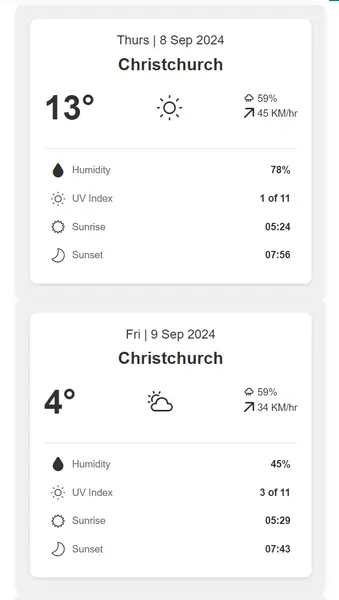
This sample transforms list items into cards formatted with weather forecast layouts.
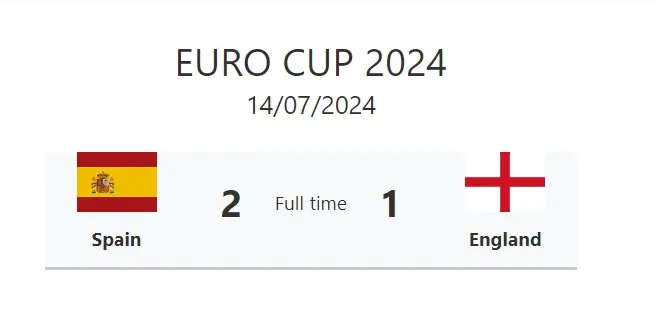
This sample transforms list items into a match summary.
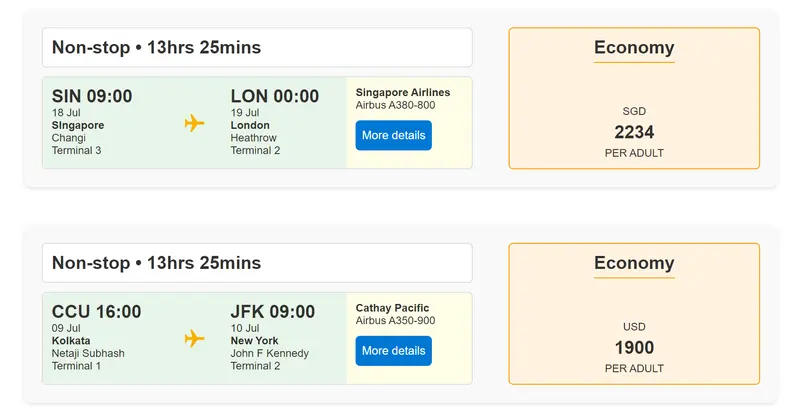
This sample transforms list items into cards formatted with flight information layouts. To ensure the view functions correctly, make sure all specified columns are included. The icons are referenced from Fluent UI Icons.
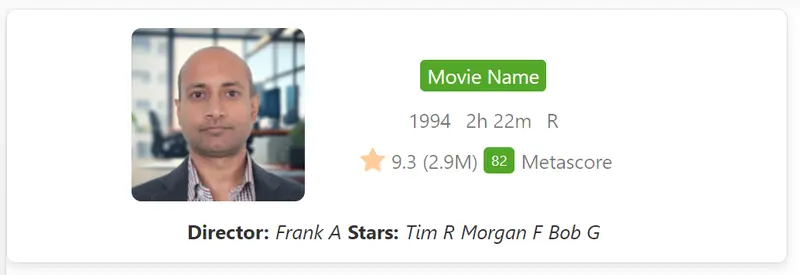
This sample transforms list items into cards formatted with IMDb (Internet Movie Database) Movie listing layout. To ensure the view functions correctly, make sure all specified columns are included. The icons are referenced from Fluent UI Icons.
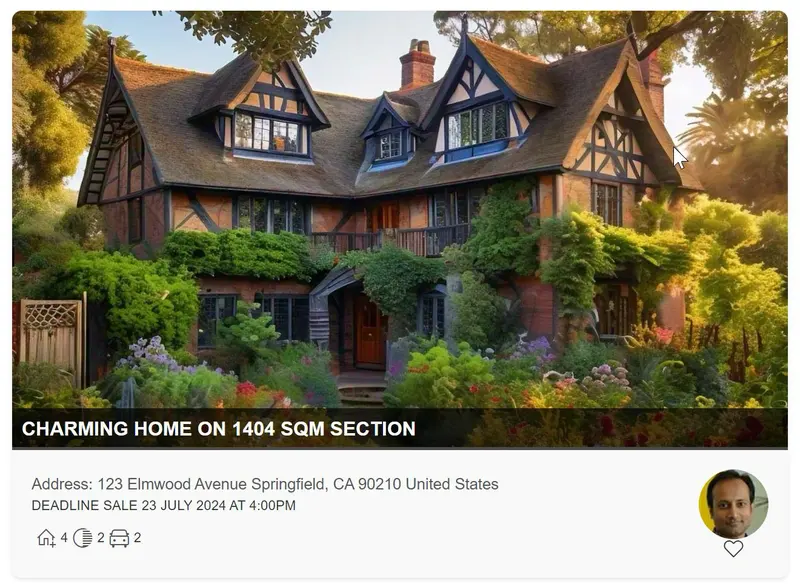
This sample transforms list items into cards formatted with property listing layouts. To ensure the view functions correctly, make sure all specified columns are included. The icons are referenced from Fluent UI Icons.
This sample displays an Icon and Title in a two column header with the Icon on the left and the Title on the right. An additional Icon and RequestStatus and added below the Title.
Formats links to look like honeycombs!
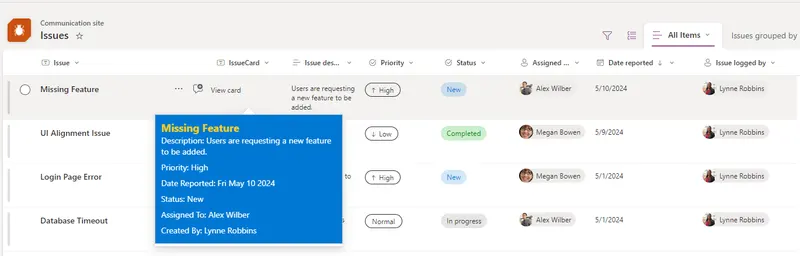
The Issue HoverCard Formatter is a SharePoint list Column JSON formatter component tailored to enhance user experience when interacting with issue data. It provides a streamlined approach to view essential information about issues through hover cards, offering quick insights in a card format.
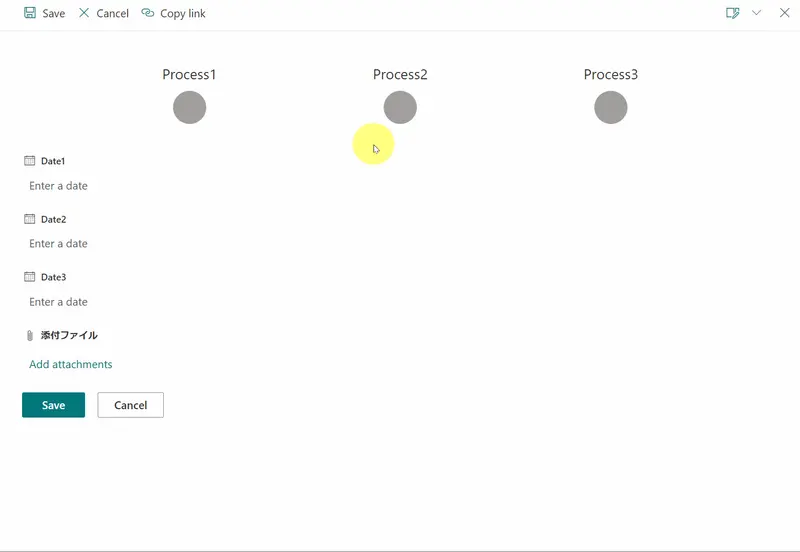
This sample shows a checkmark for each date field that has a value to help convey when milestones have been hit.
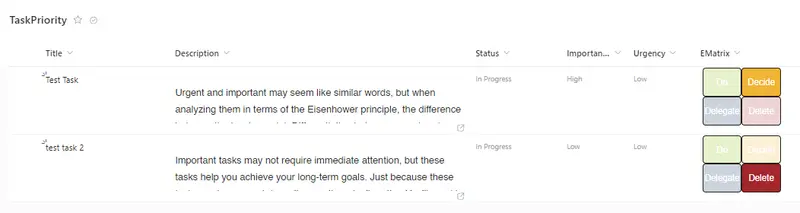
The Eisenhower Matrix is like a map for managing your tasks. It helps you decide what needs to be done first, what can wait, what can be given to someone else, and what can be left aside.
This sample provide a different style to provide Date in a compress way such us align days and month and display year parallel as vertical.
The sample list of items in a tile view where default click action is disabled. When item is clicked it is selected only.
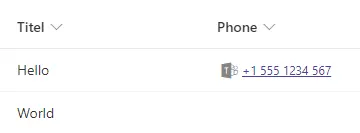
This sample demonstrates displaying a phone number stored in a single line of text column as a link to initiate a Microsoft Teams call.
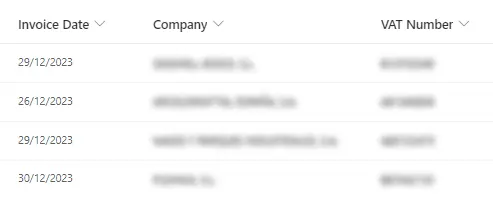
This format demonstrates how to blur the value of a field. You can use this formatting when you want to share your screen for a demo and don't want to display real data.
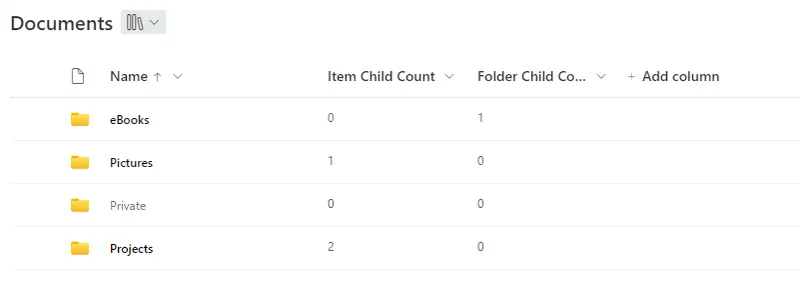
This sample shows how folders can be highlighted or grayed out depending on whether they are empty or not
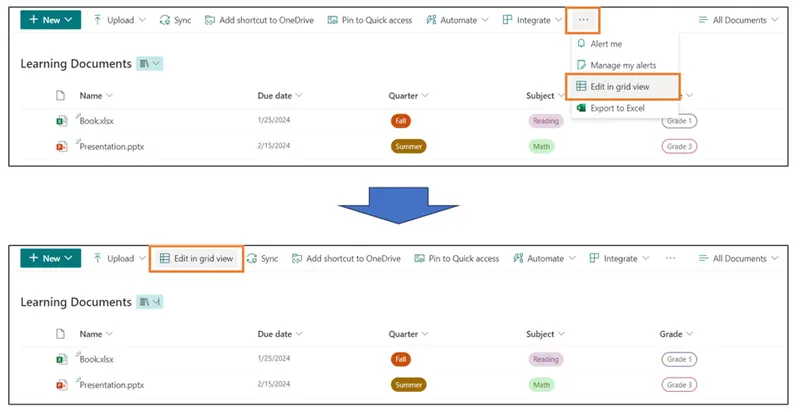
In the Document Library, the [Edit in grid view] button is hidden under the [...] button. This sample demonstrates displaying the [Edit in grid view] button on the command bar.
This tutorial will help you create a multiple thumbnail through images URLs listed in a multiple choice column.
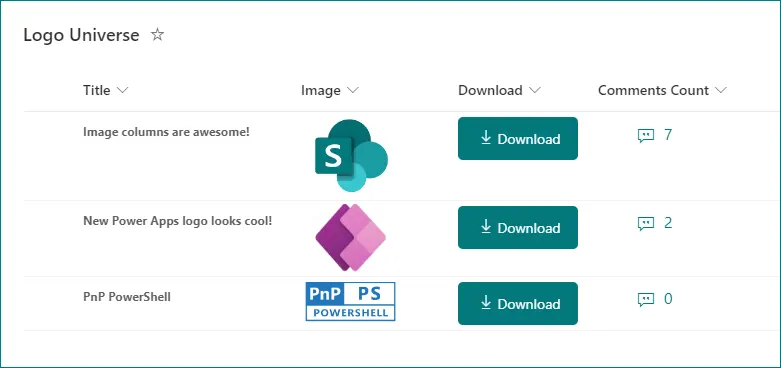
This sample demonstrates adding a button within a SharePoint Online/Microsoft Lists view which downloads the image from image column.
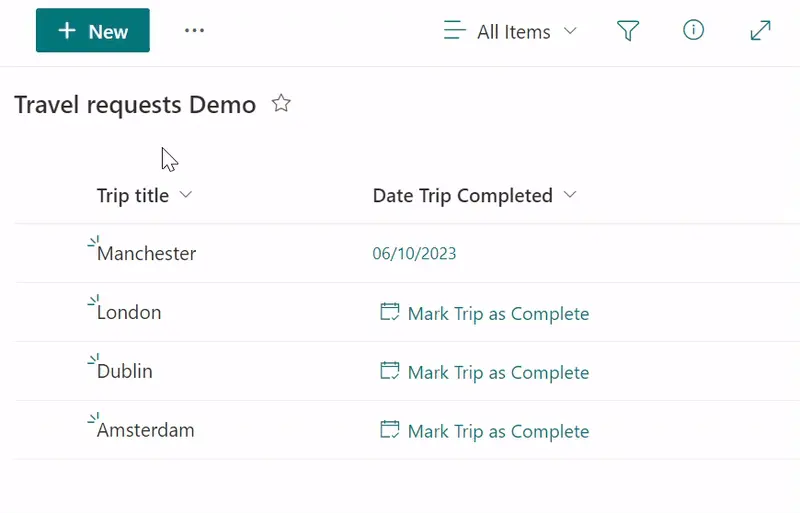
This sample a button to 'Mark Trip as Complete' (Date Field).
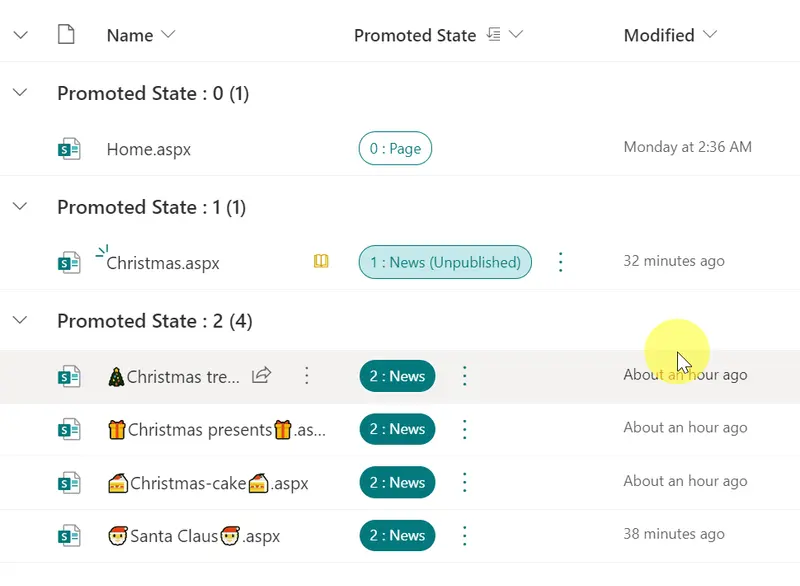
This sample demonstrates how to use the setValue action to update the value of the Promoted State column to 0 and demote the news to a page.
This sample demonstrates displaying a linear gauge from a regular string set to the split operator.
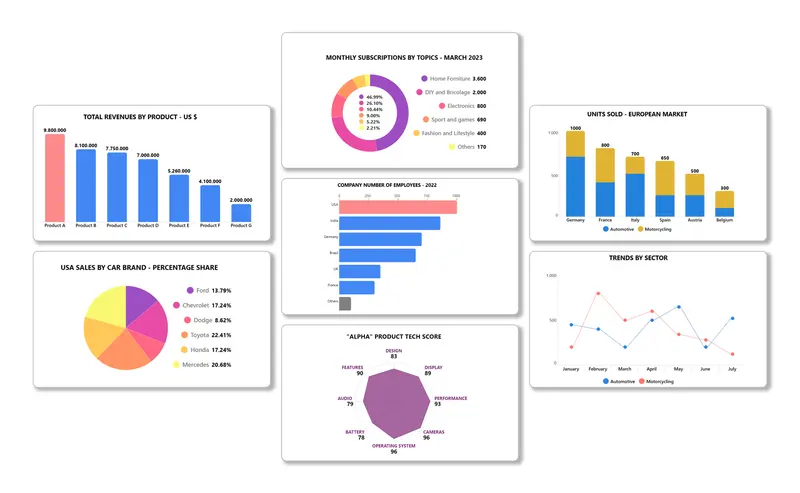
This templates package will allow you to quickly create 7 different types of charts, which you can organize into collections, share, and publish on SharePoint pages.
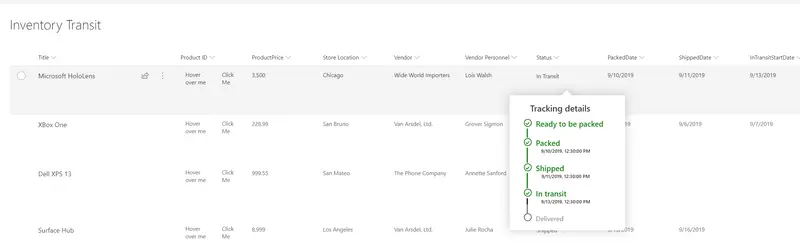
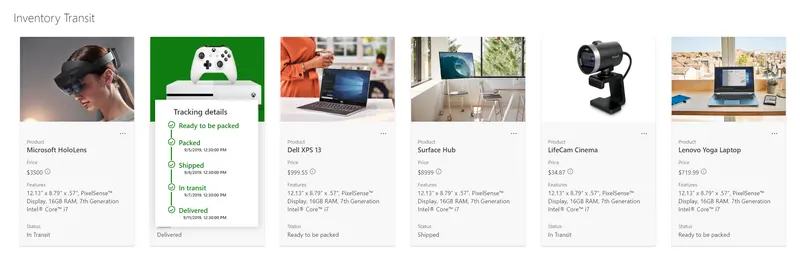
A custom card is shown on hover of an item. The hover card shows additional details about an item's status.
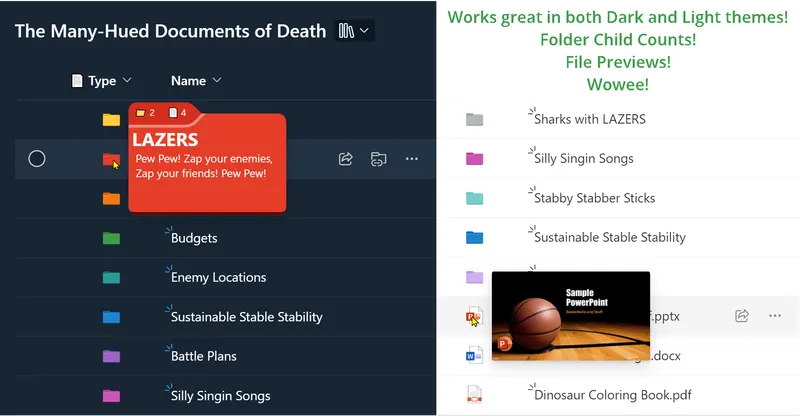
This sample demonstrates recreating the `Type` column (folder/file icons) and adds meaningful hover panels.
This sample uses Fluent UI icons and theme classes to provide a better visualization for Yes/No fields while respecting theme colors.
This sample demonstrates showing the full size image in a lightbox (hover card) rather than opening this image in a new window.
This sample demonstrates how to create a clickable rating experience in the view Tile mode. It allows users to rate the item/document when in the tile mode.
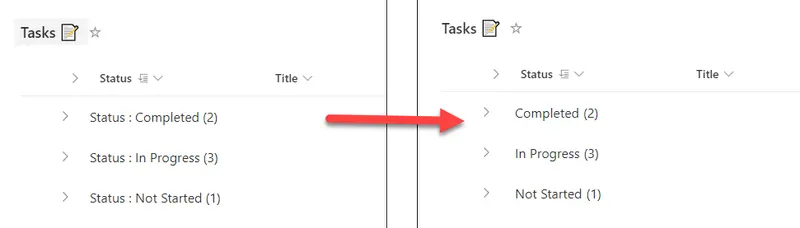
This view formatting sample can be used to customize the group header to remove column name from group header.
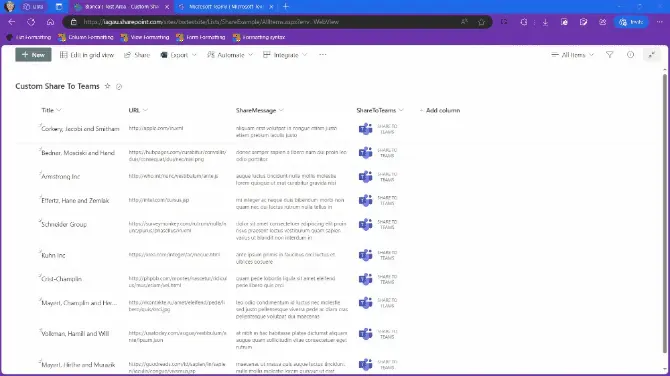
This sample demonstrates displaying a Share to Microsoft Teams screen with a message and URL.
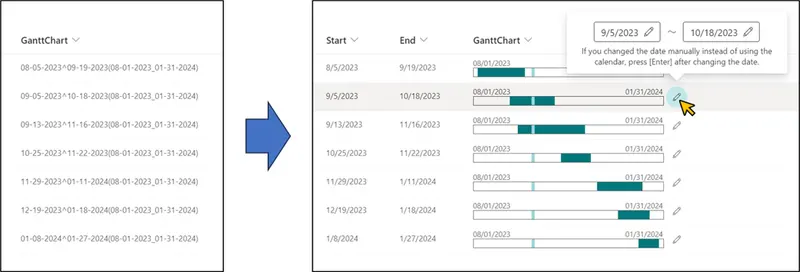
This sample demonstrates the use of the Calculated column to generate a string for displaying a Gantt chart, and then parses the string to display the Gantt chart.
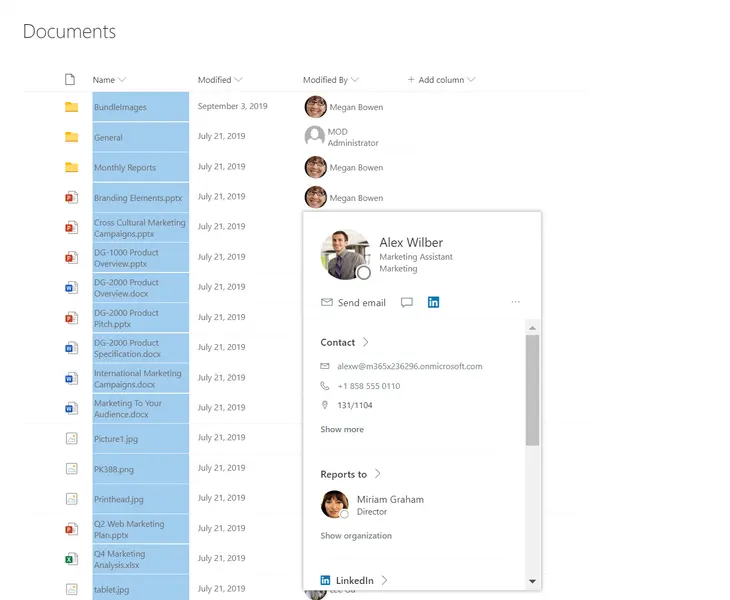
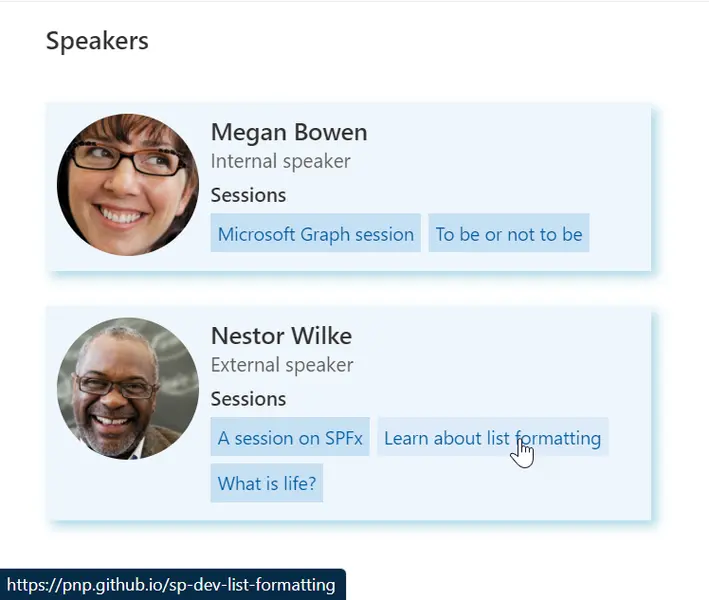
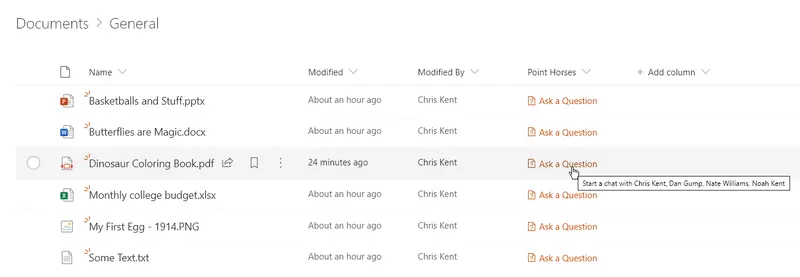
The following image shows a list with a default hover added to a formatted column in a list
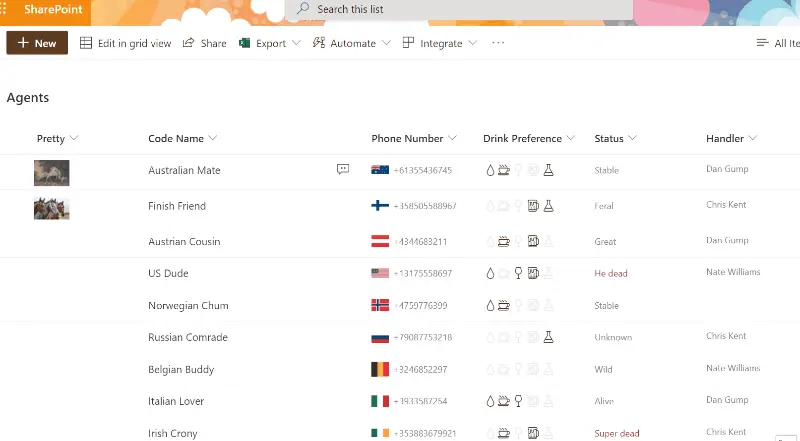
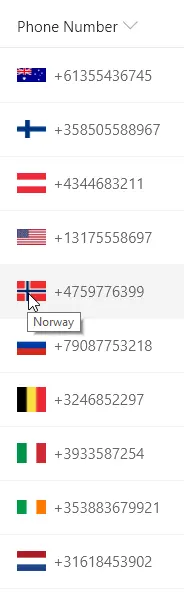
This sample demonstrates using the indexOf function (O365 only) to test if text starts with a given value. Using the international calling code at the start of a phone number, the correct country's flag is shown next to the phone number. The same nested conditionals are also used for the tooltip.
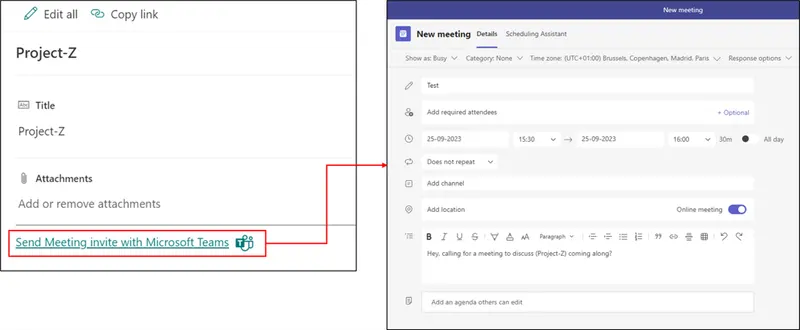
This sample demonstrates sending a meeting invite via Microsoft Teams to attendees in SharePoint list. The JSON can be used as Footer within SharePoint List formatting.
This sample is using Microsoft Teams deep links to create a link that allows a user to send Microsoft Teams messages to the user in the column.
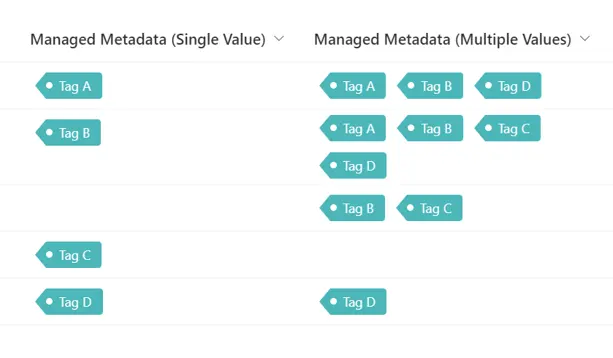
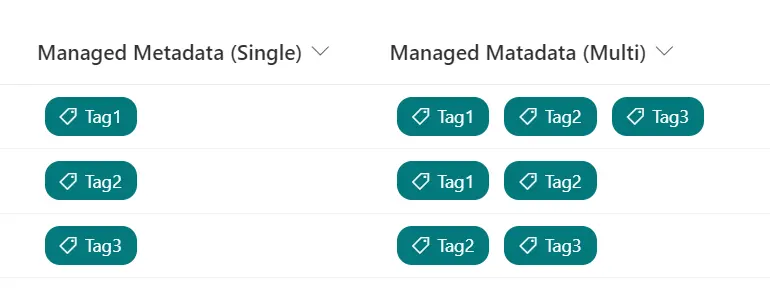
This sample demonstrates changing managed metadata values to tag-like appearance.
This sample demonstrates displaying flags of the counties selected in the multiple selection SharePoint choice column.
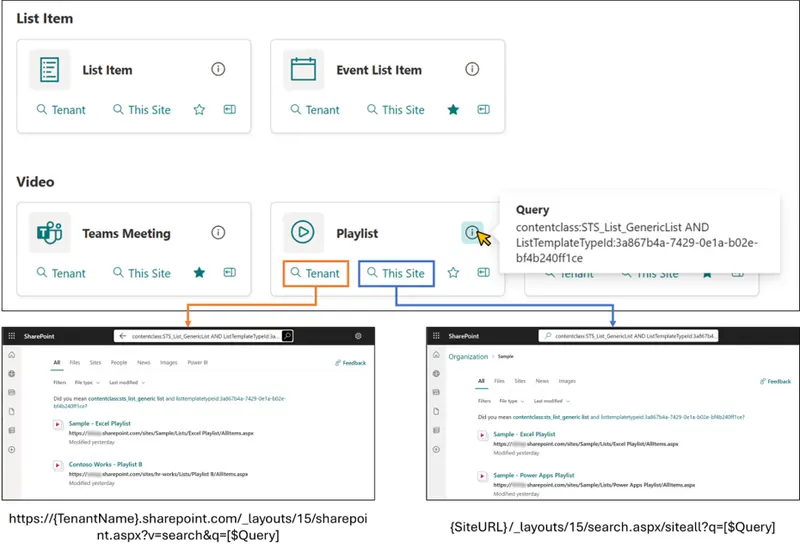
This sample demonstrates displaying links to the search page. When you open the search page, it displays the search results where the query registered in the Query column of the item has been executed.
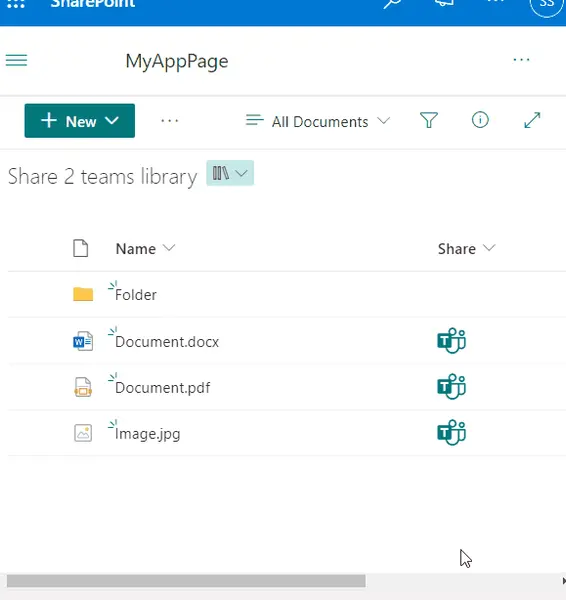
Adds an icon to share the current document in a Teams message
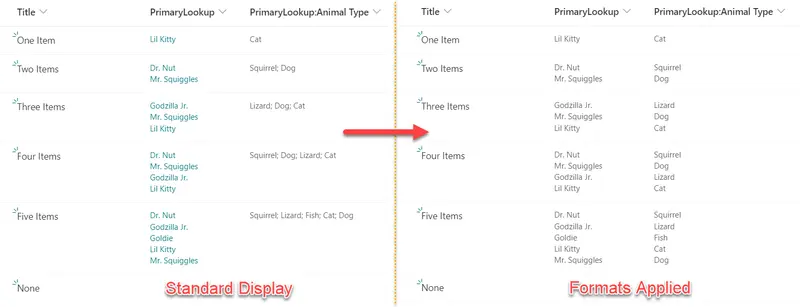
Lookup columns that support multiple values can be formatted using the advanced `forEach` property. Unfortunately, the way values are returned for any projected fields (additional columns associated to your lookup column) can present unique challenges. This sample provides two formats illustrating the difference in how these columns are formatted.
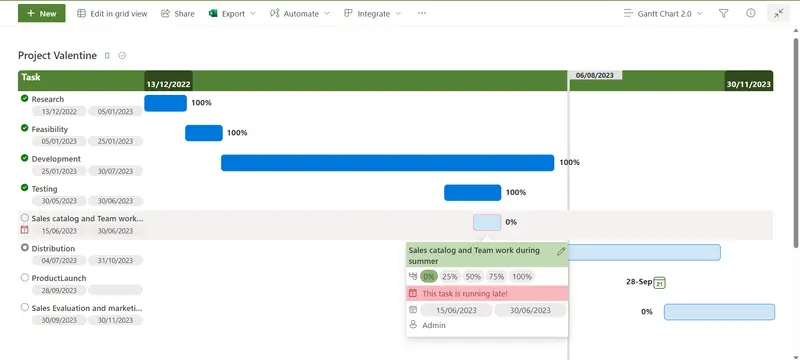
This project Gantt Chart sample demonstrates how to show a list of high level tasks in a Gantt chart. It is mainly useful for top-level views.
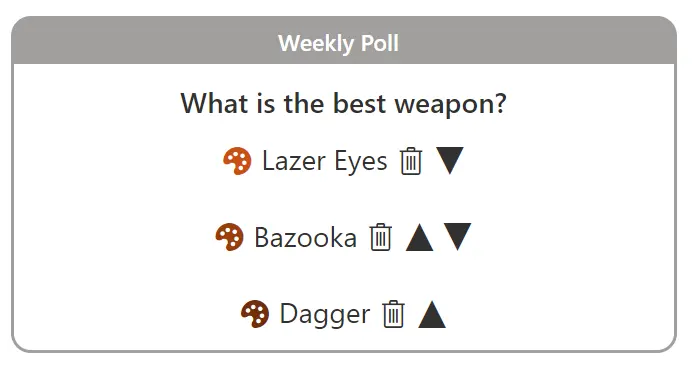
This sample combines a couple of lists and a few formats to demonstrate creating an application using view formatting. The end result is a configurable poll that end users can submit their choices too and view grouped results.
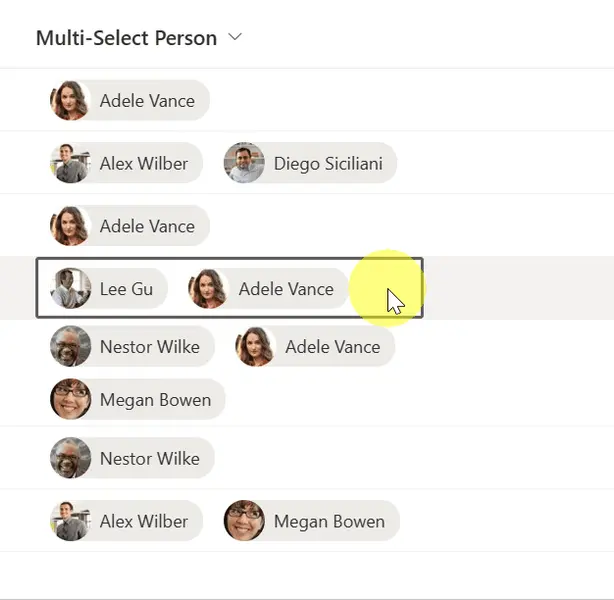
This sample provides a pill style for each person in a multi-select person field, whilst allowing inline edits.
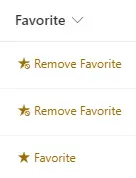
Mark a list item as a favorite
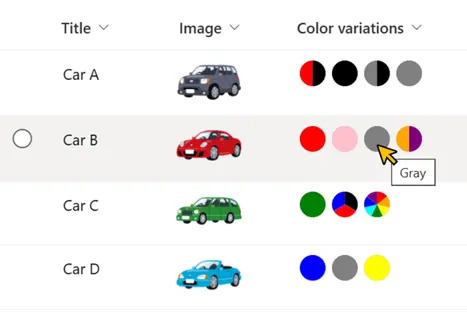
This sample demonstrates displaying a circle of the color of the value of the choices.
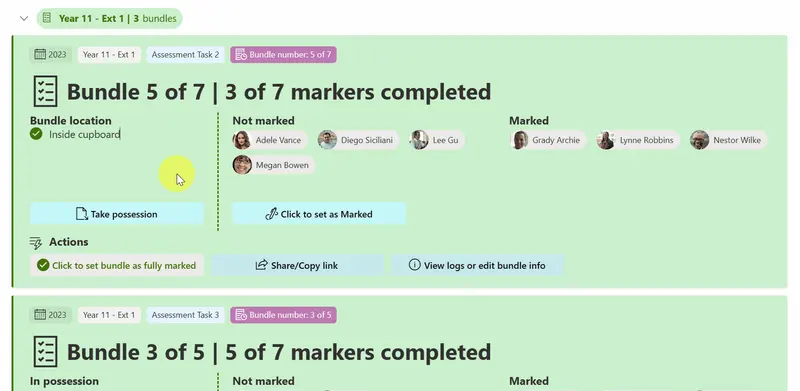
This sample transforms your list into an Exam Bundle Tracker.
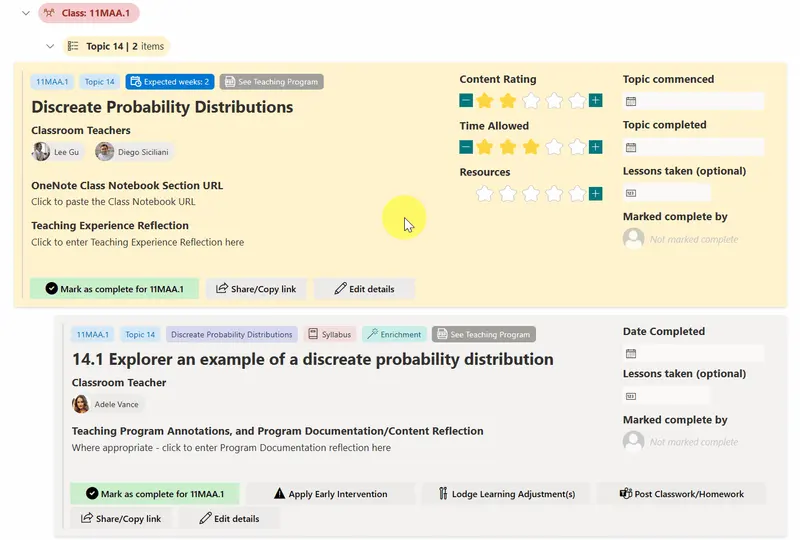
This sample transforms your list into a learning tracker.
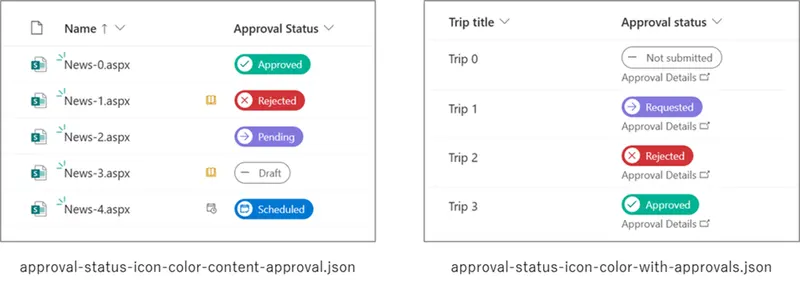
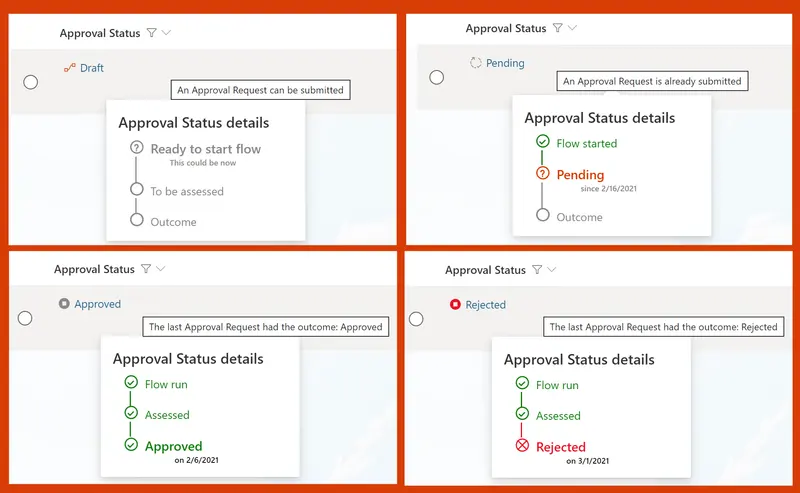
This sample demonstrates how to change icons and colors based on the value in the Approval Status column.
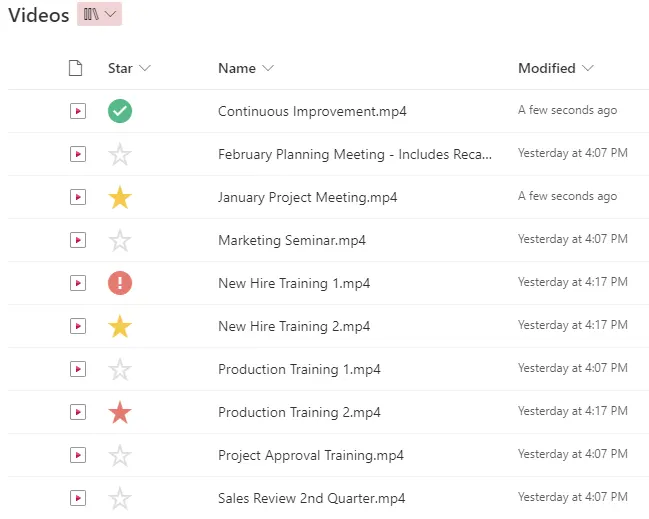
This sample formats a choice column to use star icons similar to Gmail.
This sample demonstrates how to build a button to display the version history of an item in SharePoint Online.
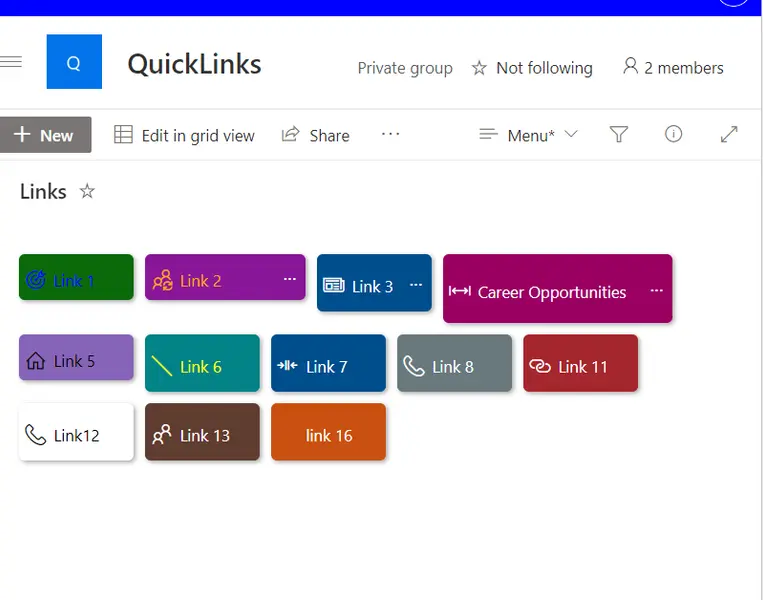
This sample allows for the creation of quick links through the use of buttons with additional features. These features include the ability to configure the button using size and color.
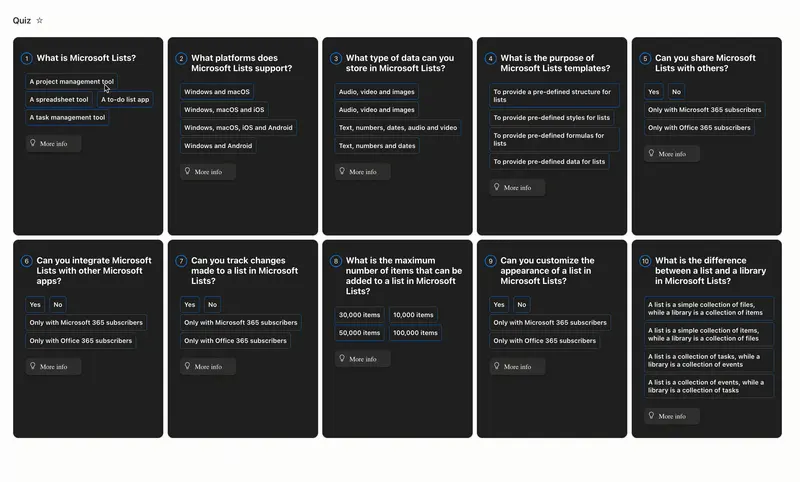
This sample creates a quiz with multiple choice questions. The tile view and custom card props provide visual feedback to users when making answer choices.
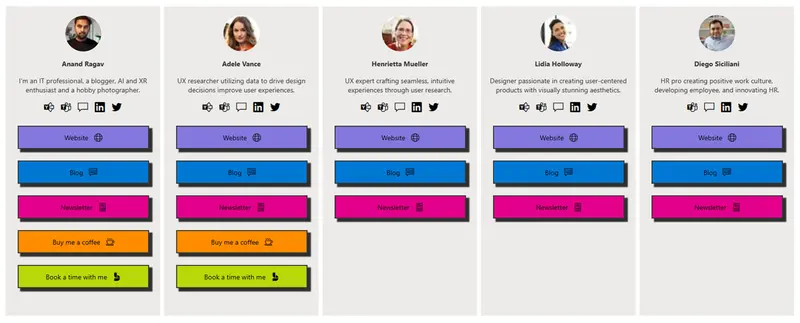
This sample creates a link in bio card for users. A Link in bio is important for people to have because it provides a centralized location where they can direct their followers or potential customers to access more information about them, their products, or their services.
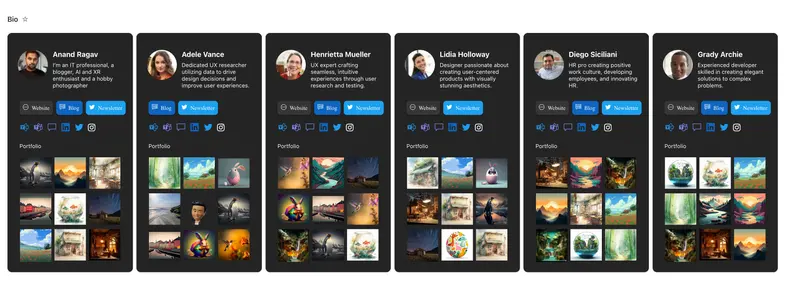
An instagram-inspired bio page for users.
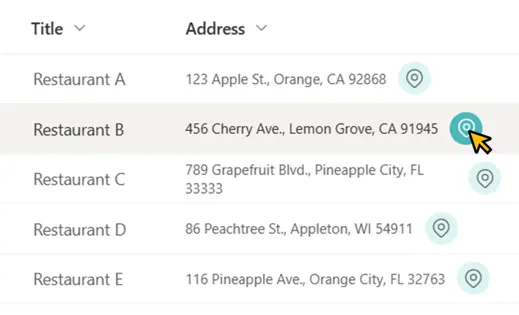
This sample demonstrates displaying a link to Google Maps. When you open that link, a map of the area around the field value location is displayed.
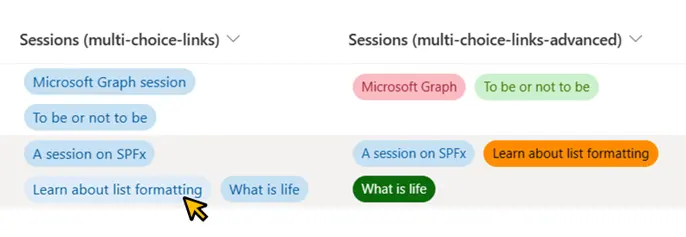
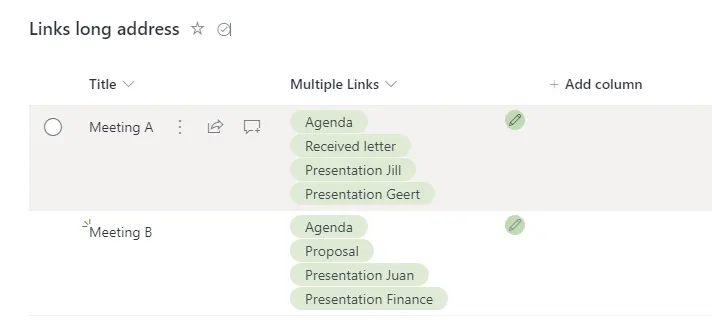
This sample shows how we can display multiple links in a single column using the multi-choice column.
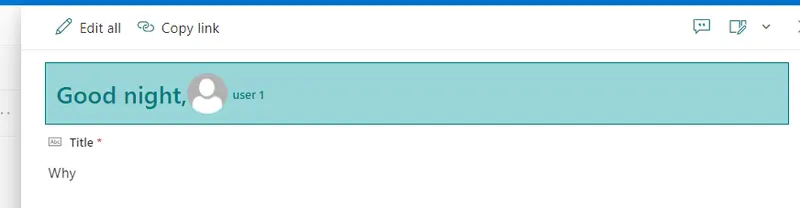
This sample demonstrates how to display Welcome message depending on time of day, display user profile image in Forms Header.
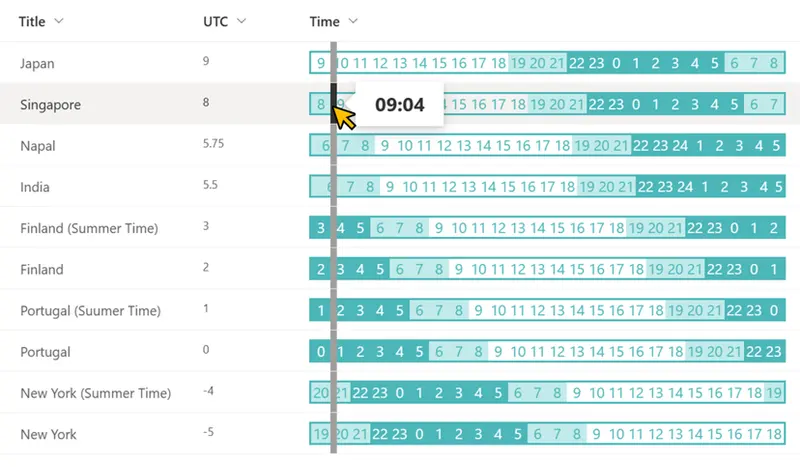
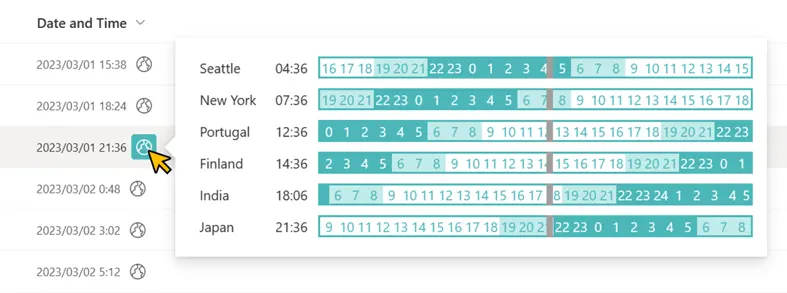
This sample demonstrates displaying the times of countries and regions of the world for a date column value that includes the time.
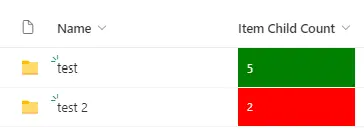
This sample shows the Item Child Count field as green when exactly 5 files are uploaded
Group by header colors green when 5 items are grouped
This sample demonstrates how to display multiple selected persons from existing field in the header.
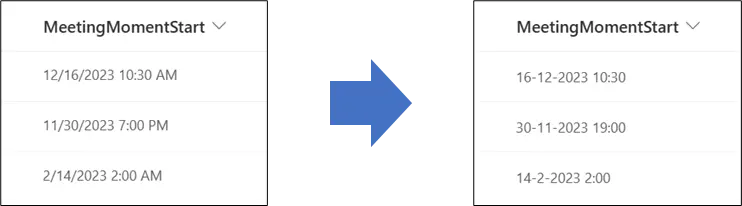
This sample provides a way to make sure that the notation of a date and time column in SharePoint is forced in a specific notation.
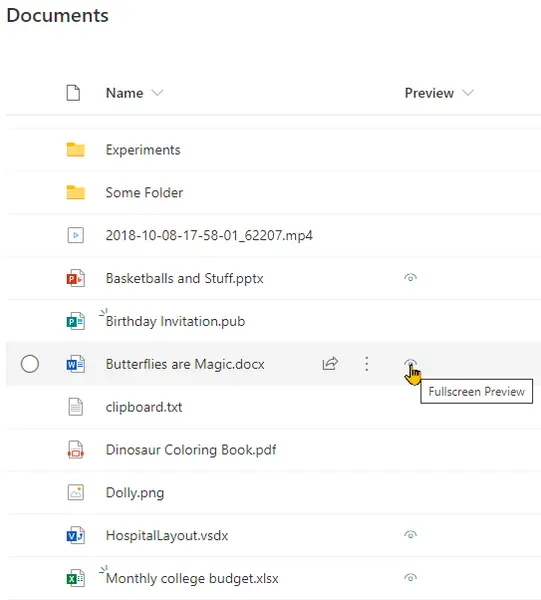
This sample opens Microsoft Office documents in full screen within a new tab. This is the same view as used in the fileviewer webpart (no toolbars).
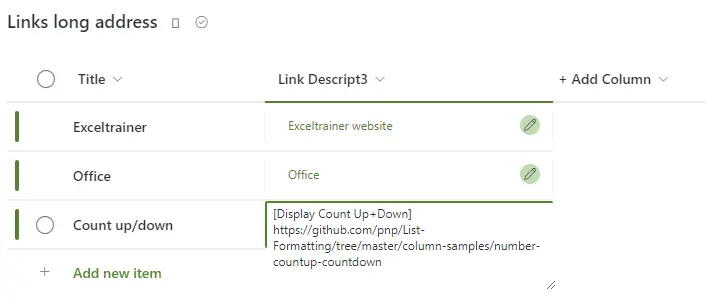
Using this sample you can have multiple hyperlinks in a single field.
The URL in a hyperlink column has a 255-character limit, which can get you into trouble. This sample demonstrates the use of a multiple lines of text column to display the link so that this limitation can be avoided.
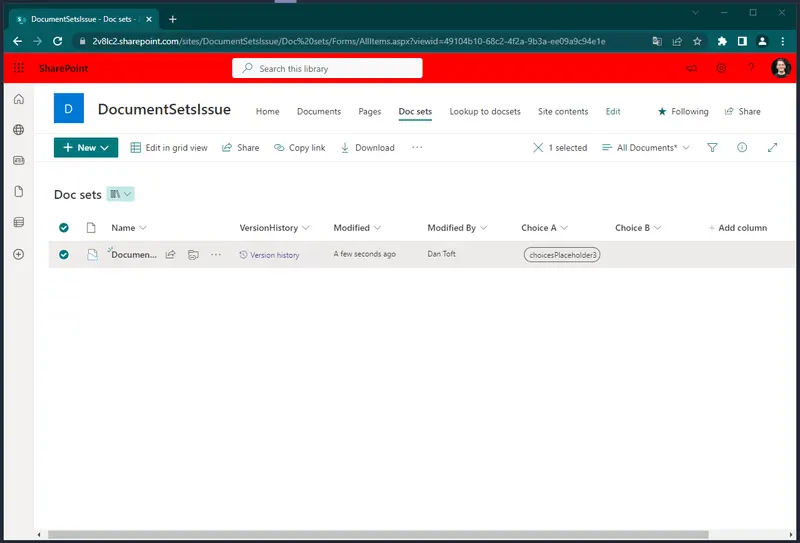
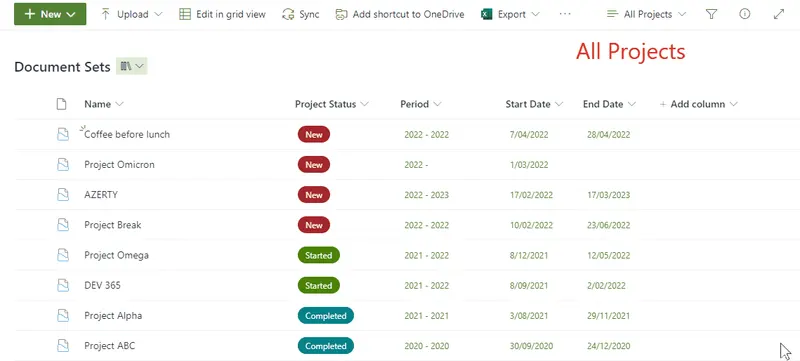
The purpose of this sample is to enhance the use of documentsets. Assuming you have a SharePoint Library with documentsets, it can be useful to create a view that shows all the files without the documentset (folder) structure. By adding a column to this view using this sample, users can open the parent documentset of a file.
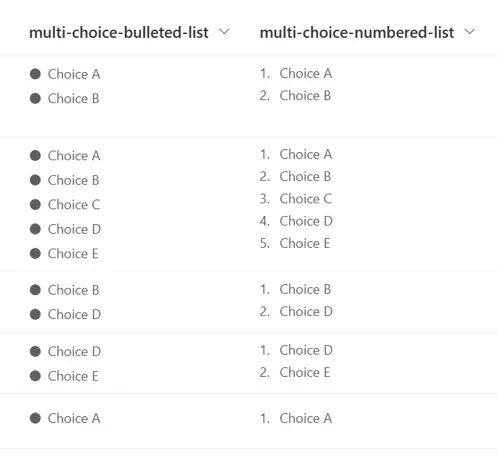
This sample demonstrates displaying Multi-Select Choice column values like a bulleted and numbered list.
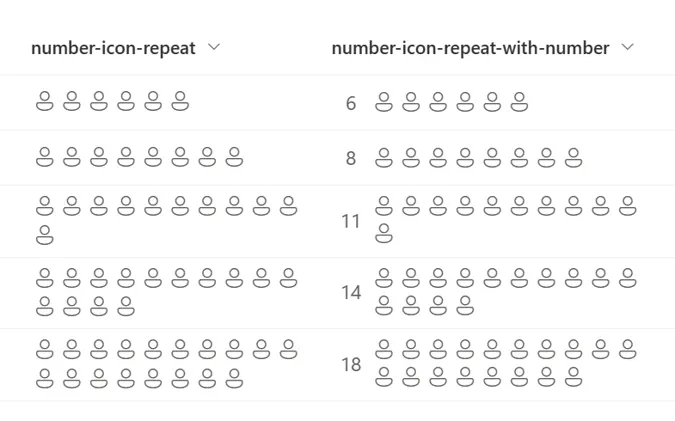
This sample demonstrates the use of the padStart and split operators to repeatedly display icons for the number of values in the number column.
This sample displays a tag icon to the left of the value in the managed metadata column.
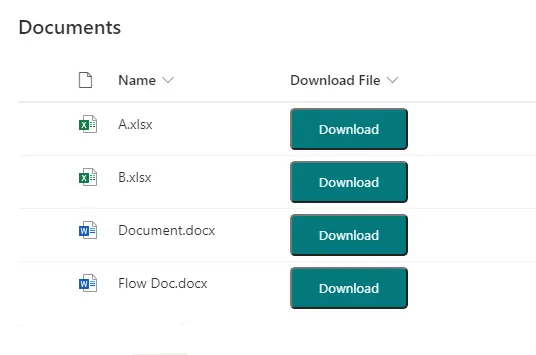
This sample demonstrates adding a button within a document library view which downloads the file.
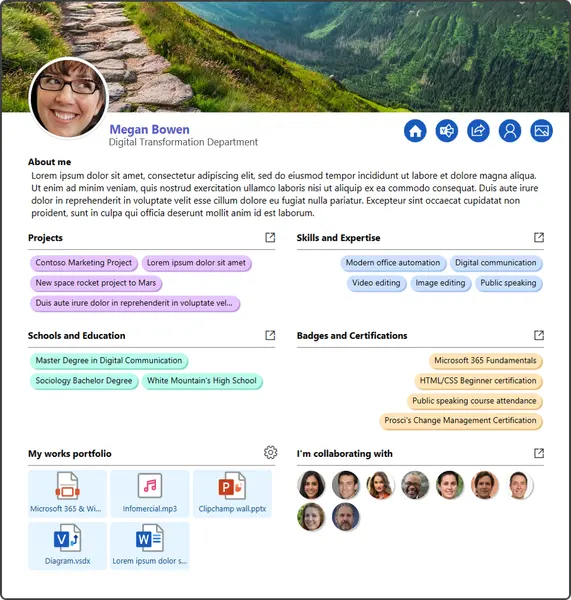
This tutorial will help you create a basic internal CV through JSON view formatting.
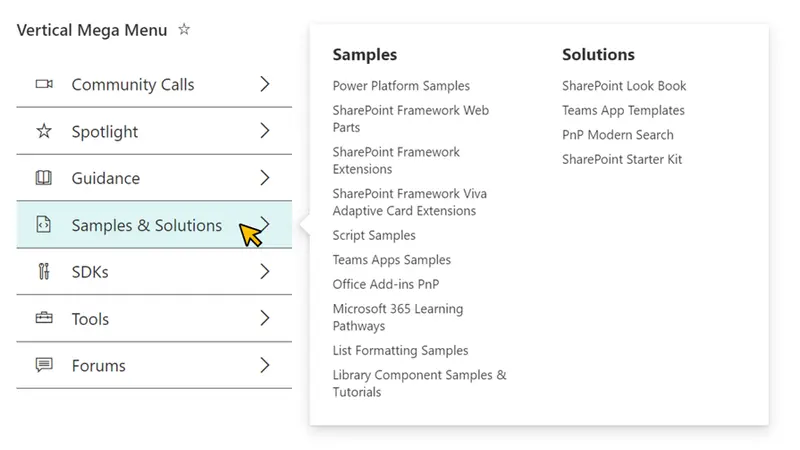
This sample demonstrates the use of multi lines of text column value and the split operator to display a vertical mega menu.
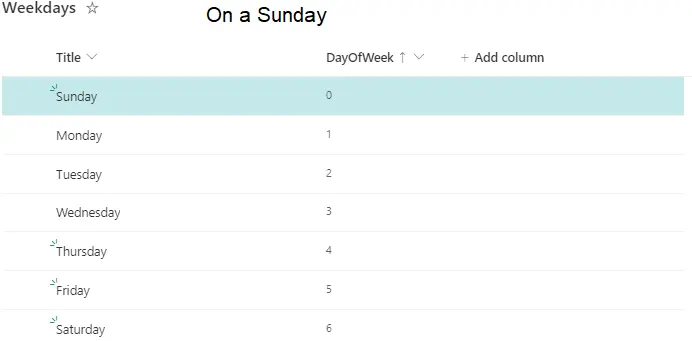
Highlight rows in a view differently on different days of the week.
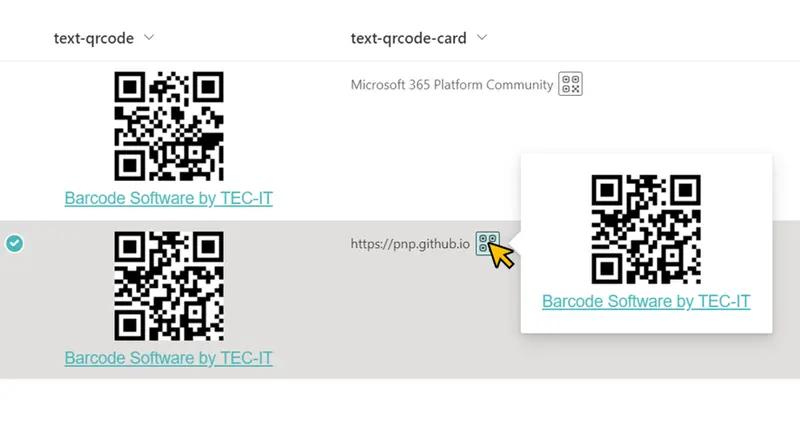
This sample demonstrates the use of TEC-IT's service to convert column value text into a QR code and display it.
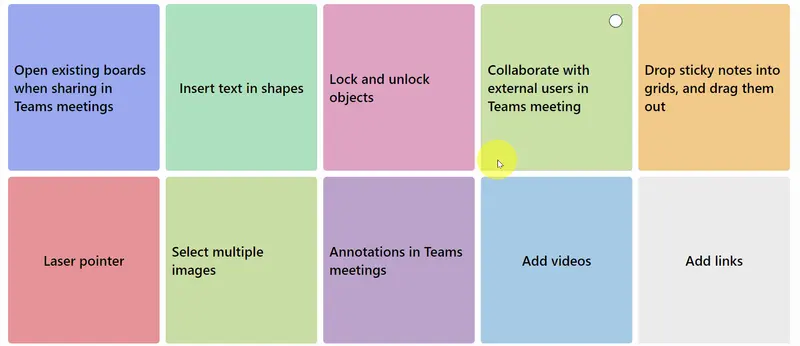
This sample creates a whiteboard-styled sticky notes that displays information. The sticky notes have two sides, so when clicked they show another piece of information.
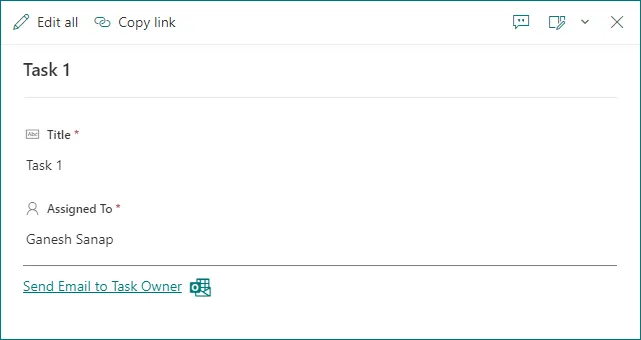
This sample demonstrates displaying Email link to send an email to task owner
This sample demonstrates formatting a document library gallery view into a photo gallery showing title and likes.
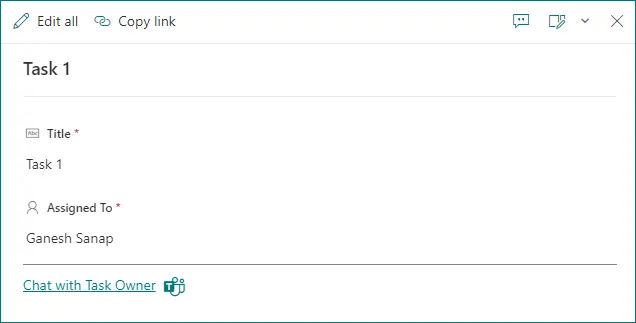
This sample demonstrates displaying Microsoft Teams chat link to chat with task owner.
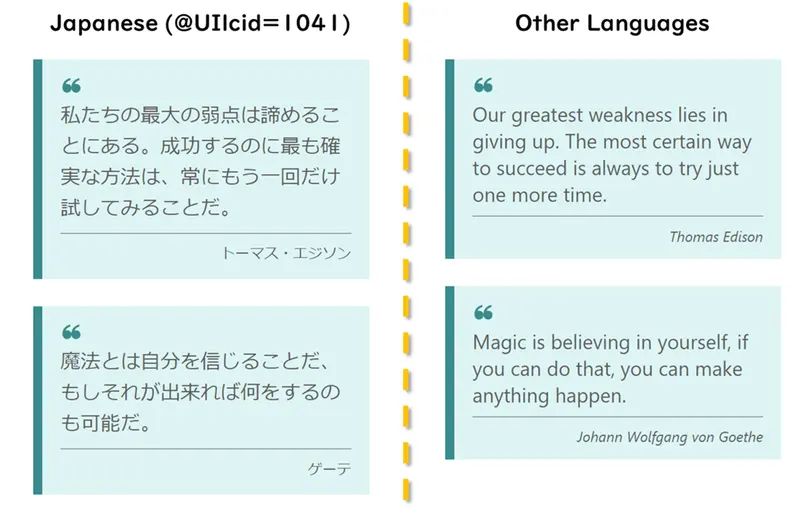
This sample demonstrates the use of the @UIlcid token to change the text displayed based on the site display language.
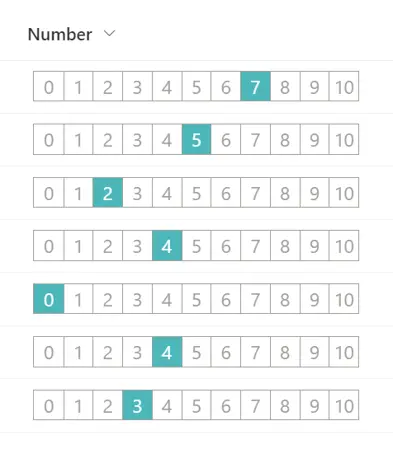
This sample demonstrates the use of the split operator to change the value of a number column to the appearance of a 0 to 10 rating scale.
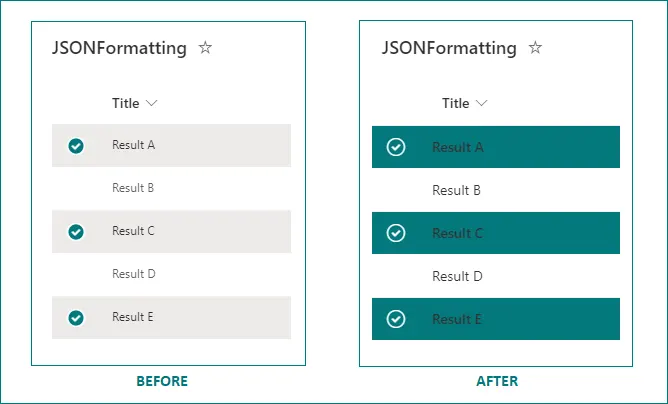
This sample highlights selected list item rows in list view.
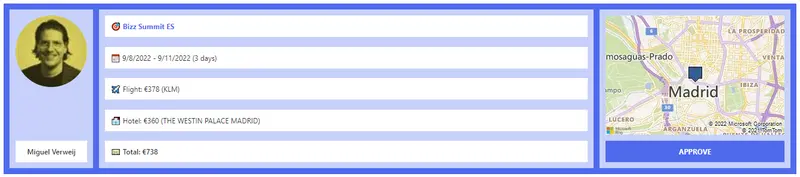
This sample formats the SharePoint list template Travel requests.
This sample can be applied to a column in a Document Library to render a link that will open an Office Document as a pdf.
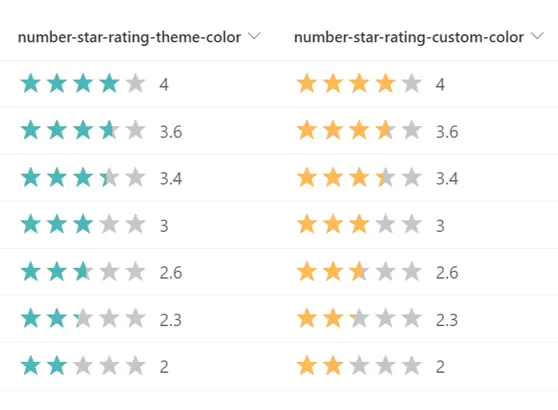
This sample demonstrates changing the value of a number column to a star rating.
This sample demonstrates how to prompt users to copy a file link from a specific library and displays it in the column.
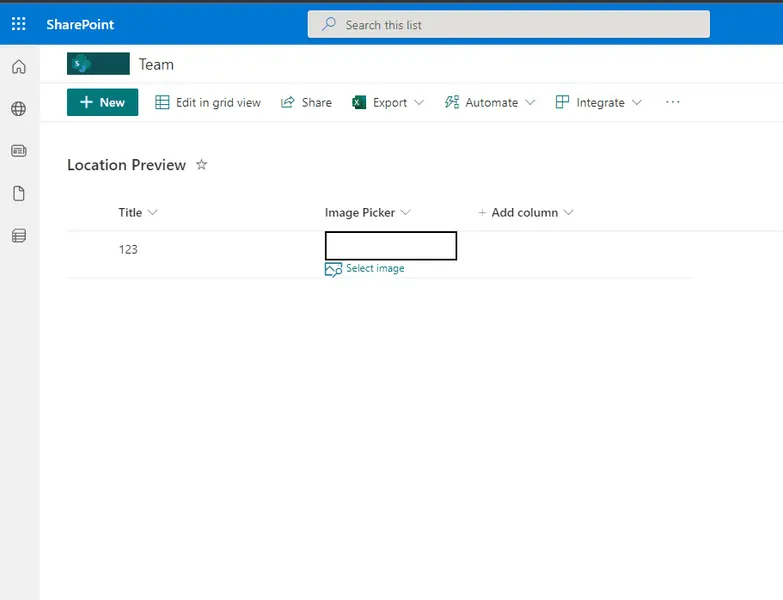
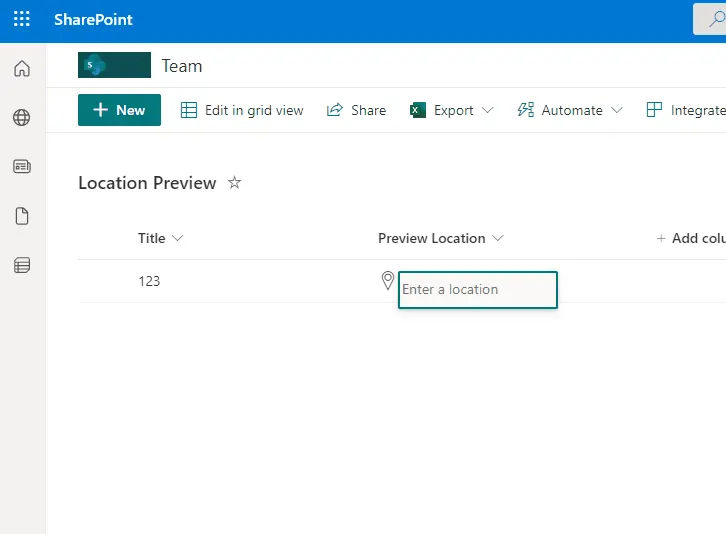
This sample demonstrates how to use a Location column to display details and a Map from Bing.
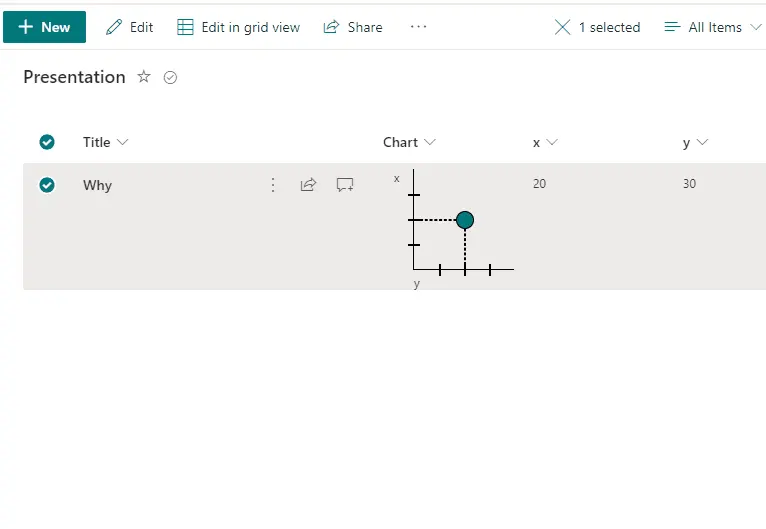
This sample demonstrates making one point chart with support of 2 numeric fields (x,y) with dialog description.
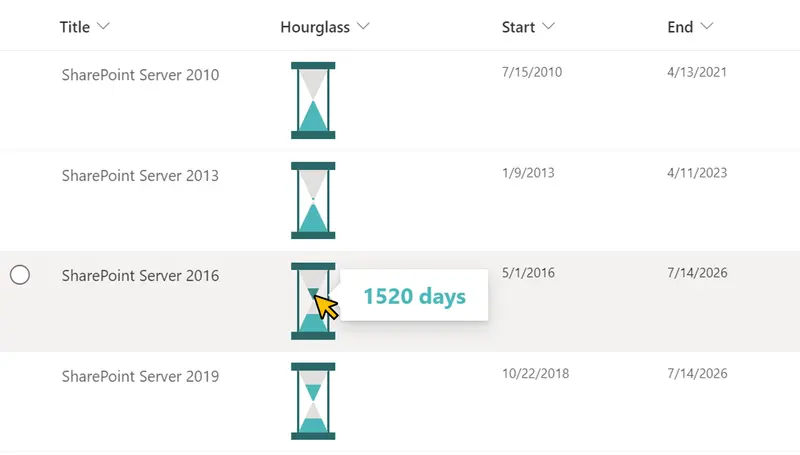
This sample demonstrates displaying an hourglass.
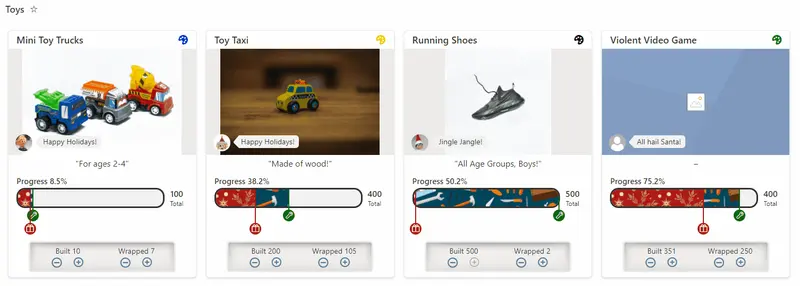
This sample demonstrates displaying a percentage across a bar. End users are able to edit the values by increasing/decreasing in 25% increments using arrow buttons.
This sample demonstrates changing text output based on the @lcid token. This allows you to provide localized text within your format ensuring that users in various regions can use your formats without issue.
Demonstrates creating a button to register for a course.
This sample demonstrates changing text output based on the @lcid token. This allows you to provide localized text within your format ensuring that users in various regions can use your formats without issue.
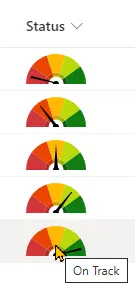
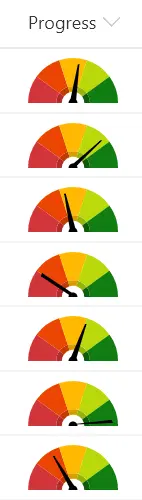
This sample demonstrates combining a fixed SVG (gauge background) with a dynamic SVG (needle). The values are based on text values (choice or text).
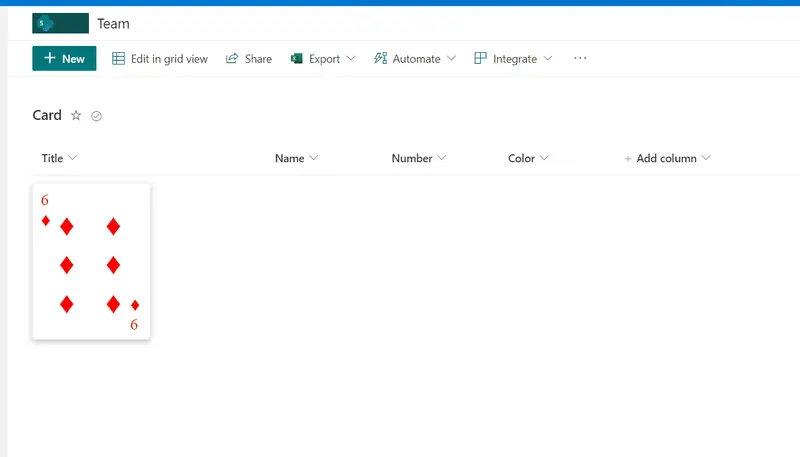
This sample display formatted number column as playing card.
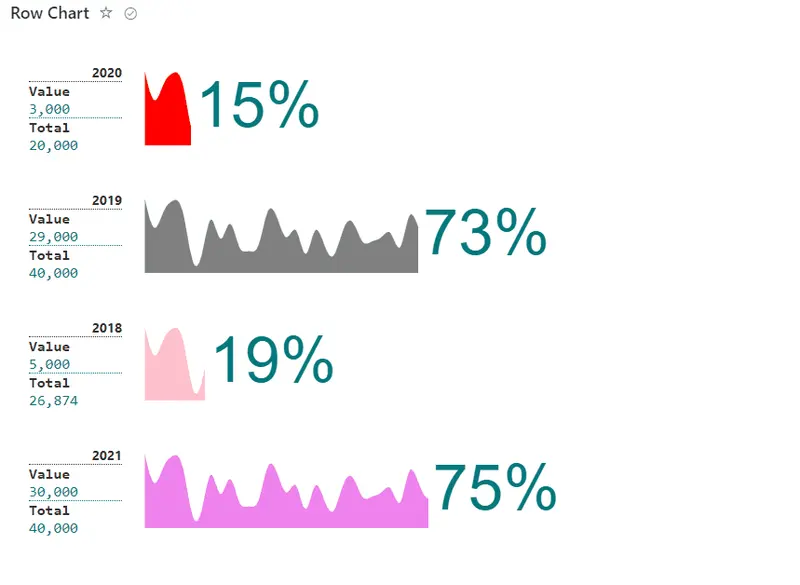
This sample display formatted percent chart row based on icon/emoji/svg and associated result number, used is able to manage to total and used items for percent calculation.
Demonstrates the use of the id attribute to create linkable anchors.
This sample conditionally shows a button to launch a flow. Additional details are provided to customize the flow panel title and button. This provides context to users and is often far more meaningful than the default of 'Run Flow' which generally doesn't mean much to end users.
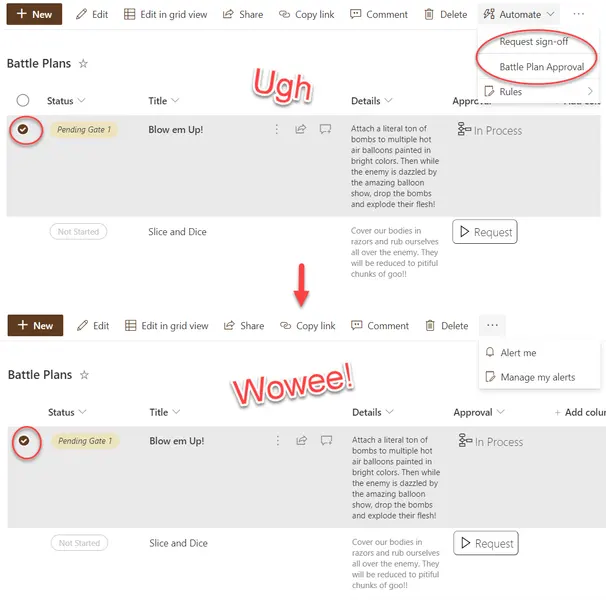
Hides the Automate button when an item or items are selected.
This sample demonstrates utilizing layering to draw all rows on top of each other and then the z-index is set to a randomized value to determine which row to draw on the very top.
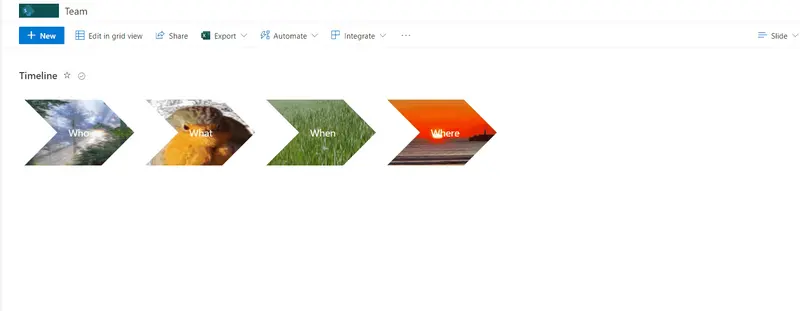
This sample how to create chevron style shape with background image. When mouse over image popups and display title and description.
This sample demonstrates a gradual background color change between the minimum and maximum values.
This sample shows a gauge in the list footer (when aggregates are enabled).
This sample demonstrates creating a layered dynamic SVG image in a view format.
This sample shows text from the most recent items by showing them in decresing sizes as they get older.
This sample demonstrates displaying a button to update the fields values of an item.
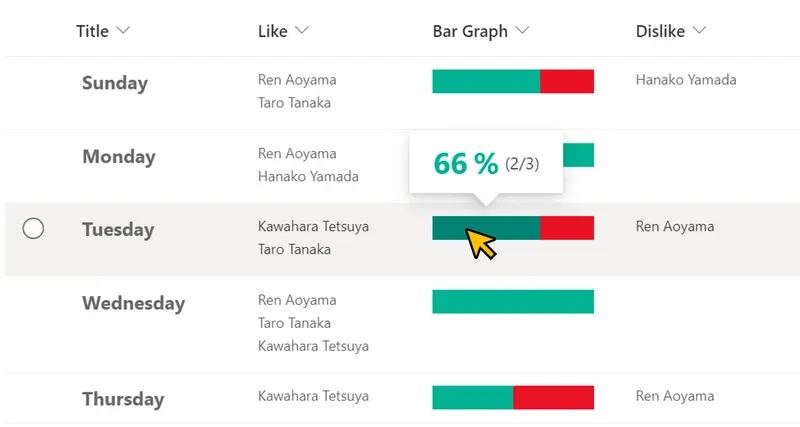
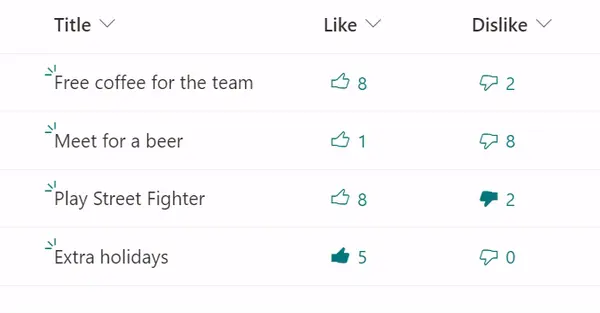
This sample demonstrates displaying a Like/Dislike bar that visualizes the ratio of Like to Dislike users.
This sample demonstrates displaying timelines in Board View.
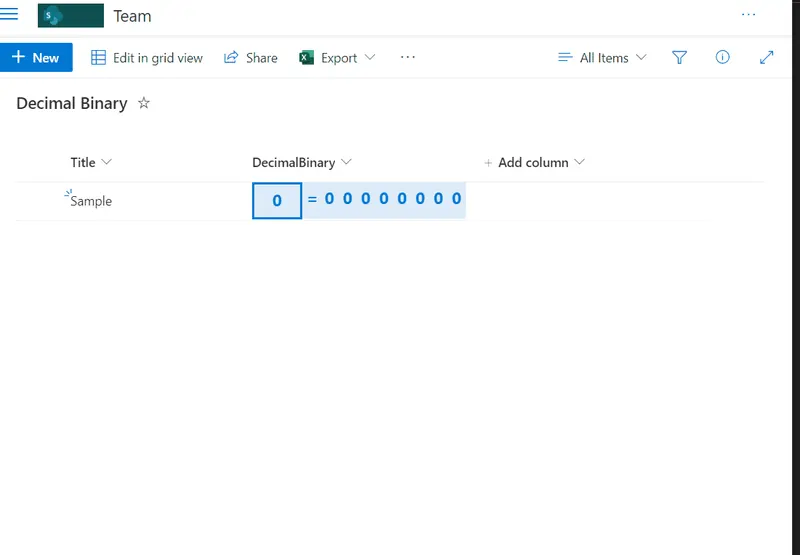
This sample provides decimal conversion to binary using standard List formatting math functions.
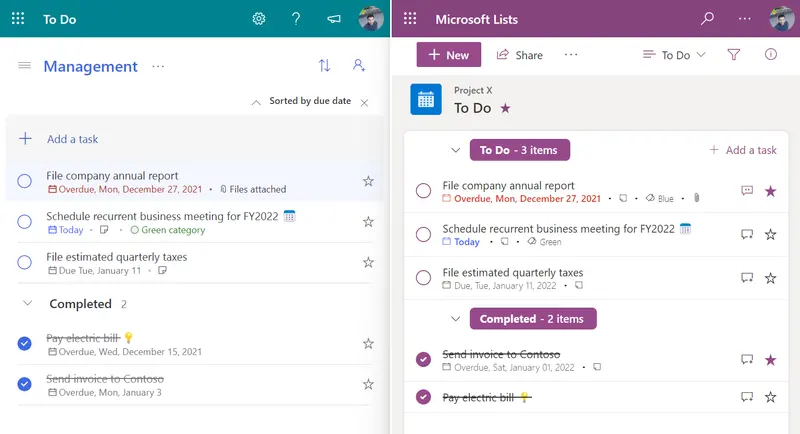
This sample formats your SharePoint list view to look like Microsoft To Do.
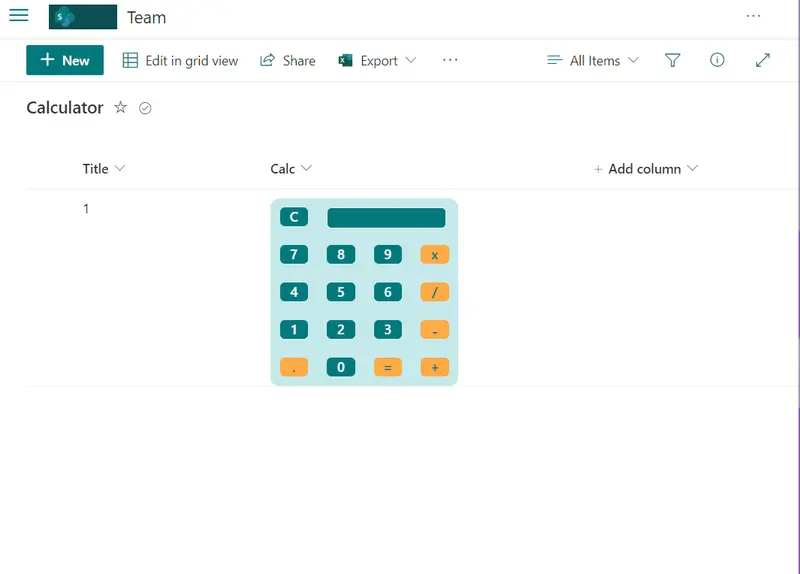
This sample includes design capabilities and formulas to simulate a simple calculator.
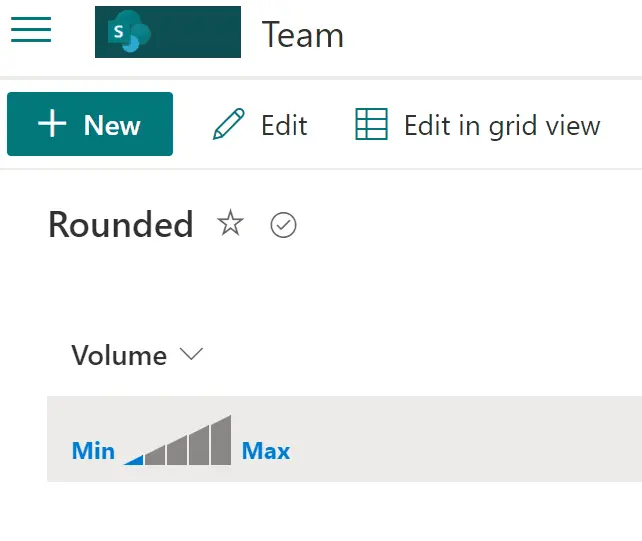
This sample includes visual selection of volume from 0 to 5.
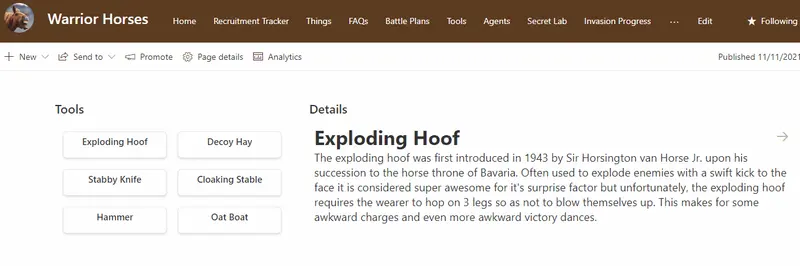
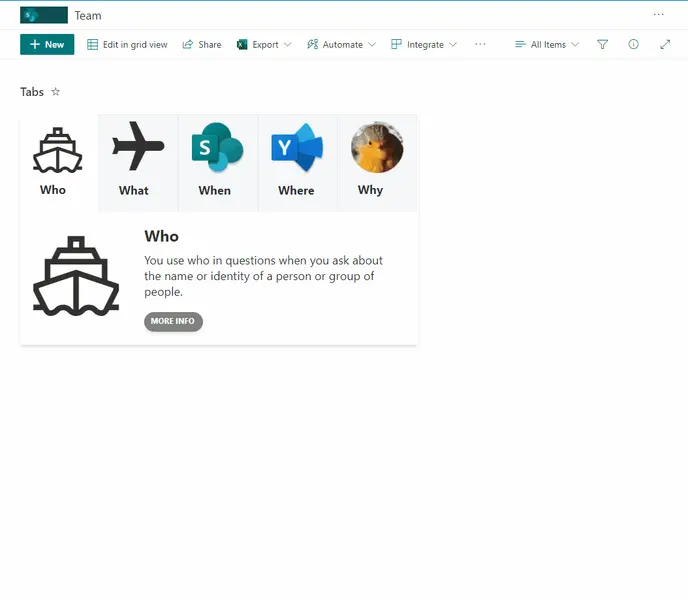
This sample creates tabs with associated content. Users can then navigate between tabs. This sample is intended to display content within a SharePoint page (using the lists webpart) to provide a more interactive and user friendly approach.
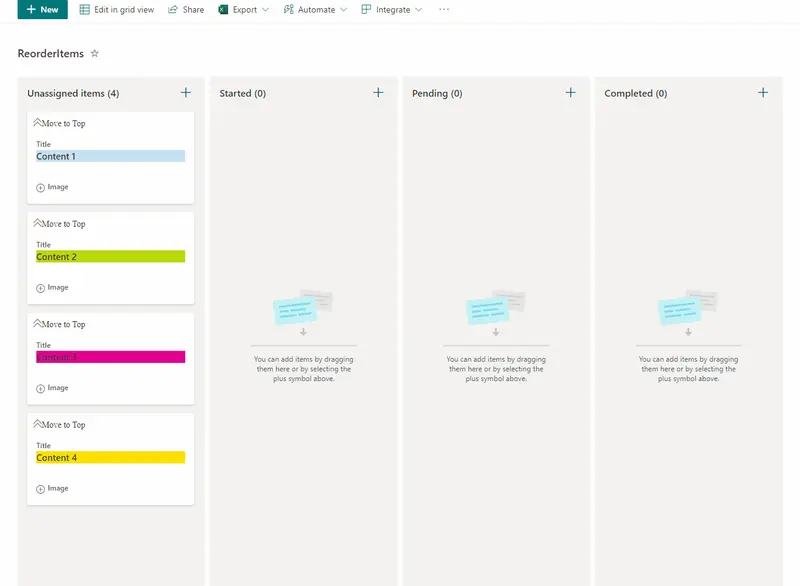
This sample allow users to manage card order in Board Views and also enables expanding and collapsing images. This sample has the option 'Move to Top' that allows users to move cards to the top of the board view as a way to rearrange card positions.
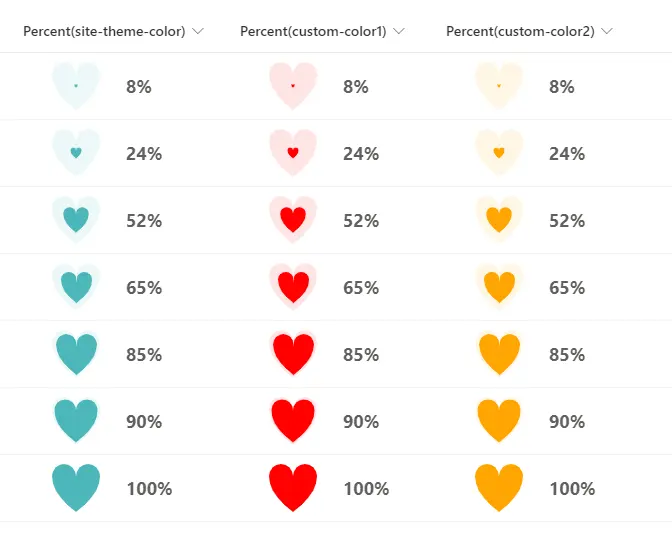
This sample demonstrates how to change the size of a heart by using the percent value of a numeric column.
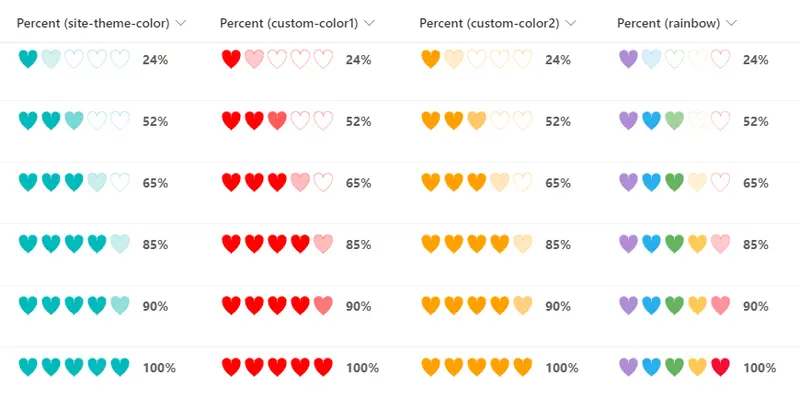
This sample demonstrates how to express percentages in terms of the color shading of a heart displayed in SVG.
This sample demonstrates displaying a ribbon in the header.
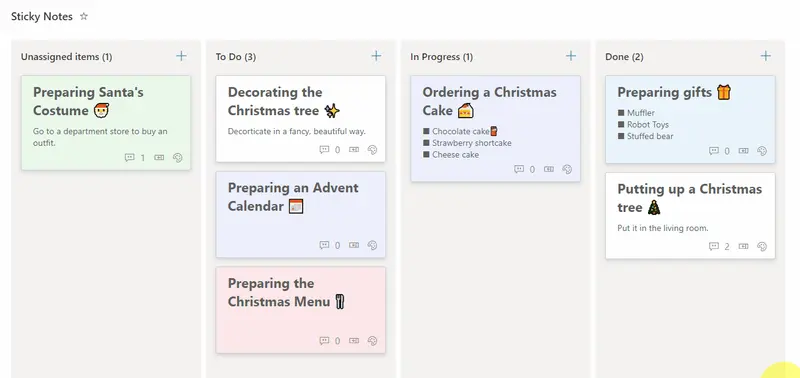
This sample demonstrates how to display sticky notes in a Board View.
This sample demonstrates how to display Praise Cards. By creating a Praise Card, you can express your appreciation and admiration to others for their daily cooperation and actions!
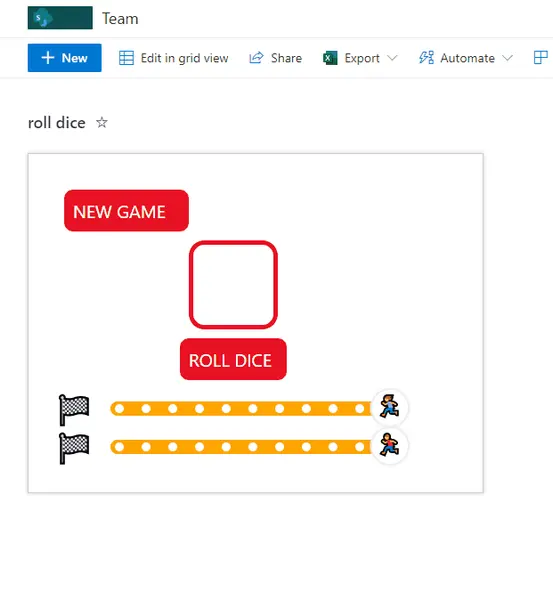
This sample format provides a simulation of a game where a random number (between 1 and 6) is generated and displayed as a die. The value makes the progress bar advance with the associated emoji until the value 0 is reached and the winner emoji appears.
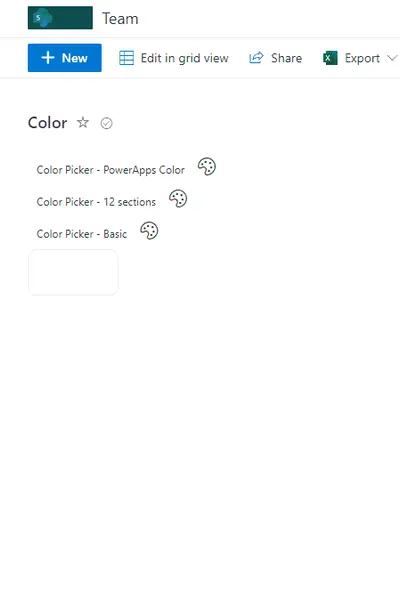
This sample contains pre-defined palettes of color (default matches Power Apps). These palettes are then made available as a color picker setting the value on selection.
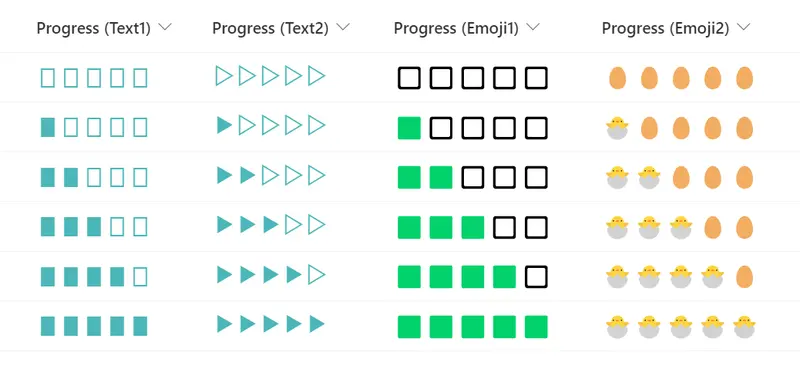
This sample demonstrates the use of text symbols and emoji to display a progress bar.
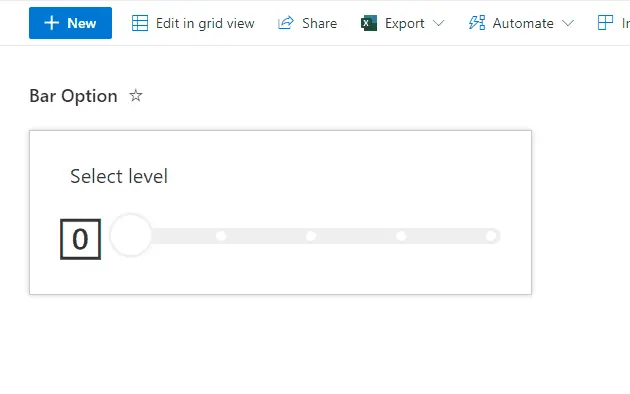
This sample displays a bar with multiple options. When an option on the bar is clicked, the Value column is updated to the corresponding value (0-4) using setValue.
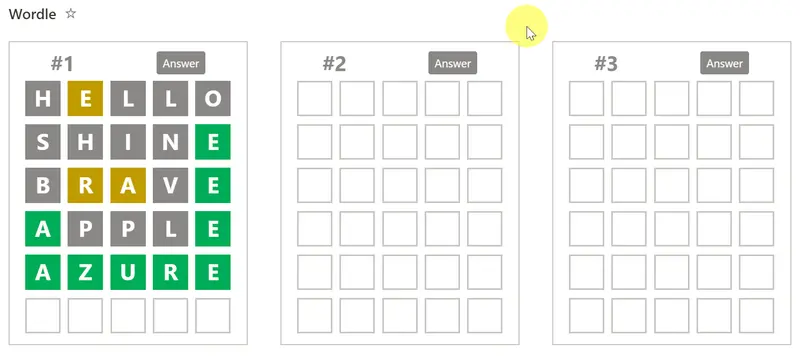
This sample reproduces the popular word puzzle game Wordle with Microsoft Lists.
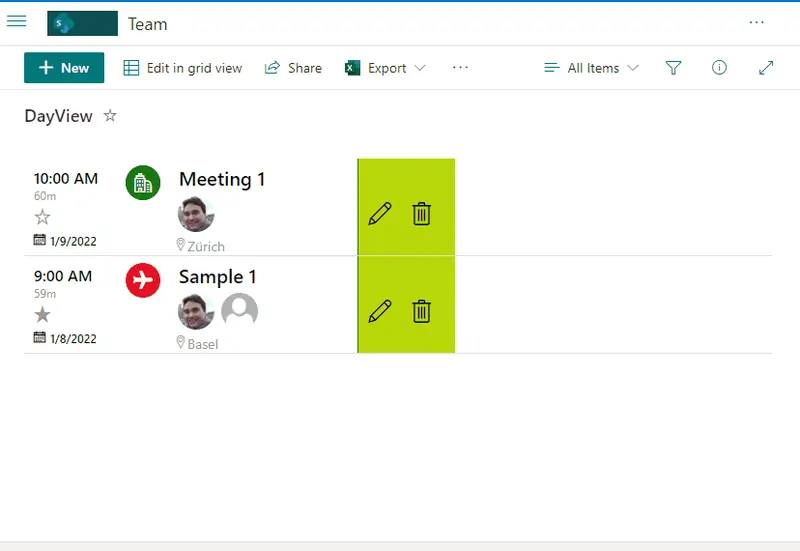
This sample provides Event registration with different capabilities such us Start and End dates, Category, Attendees, All Day option, Location, Team URL, and favoriting.
Demonstrates creating a button to register for a course.
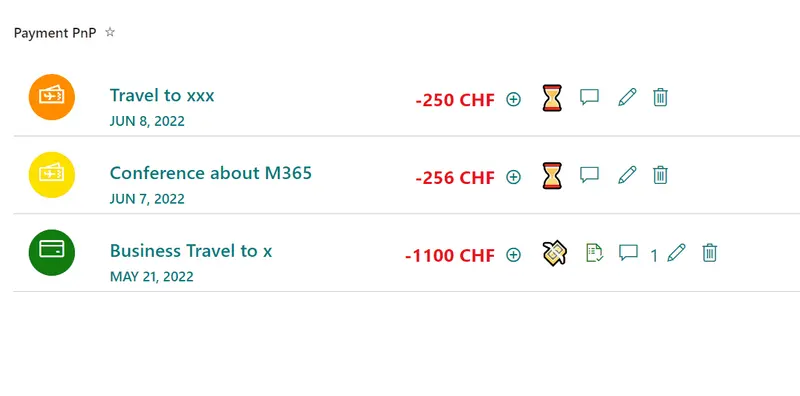
This sample provides a payment list format to register daily expenses, currency, status, rate option, comments and categorization of payment. Solution has 3 formats Desktop, Mobile and Group by Category.
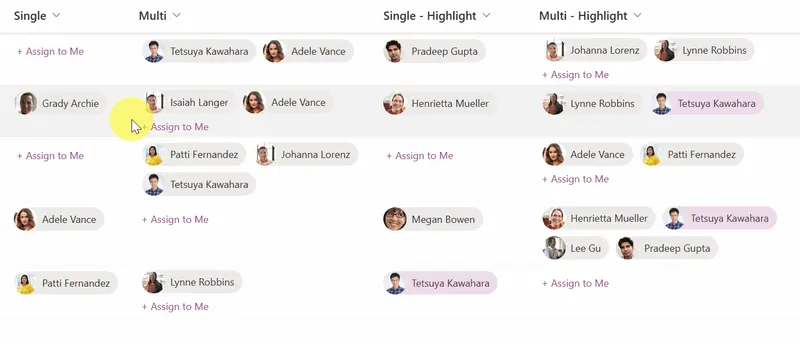
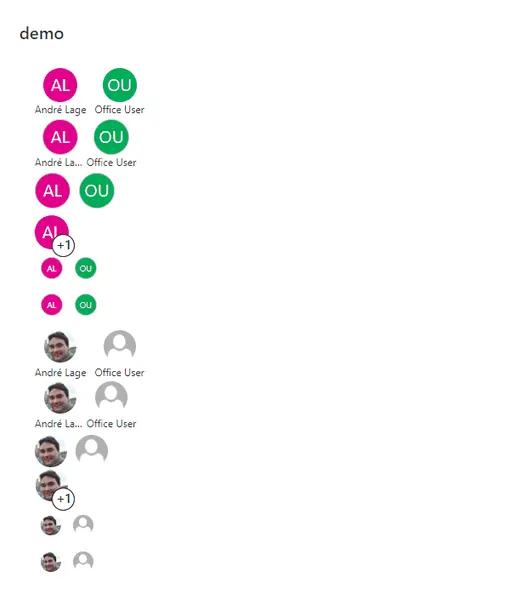
This sample provides multiple formats illustrating different ways multi-person field display and inline editing can occur. The field is rendered multiple times to show different options.
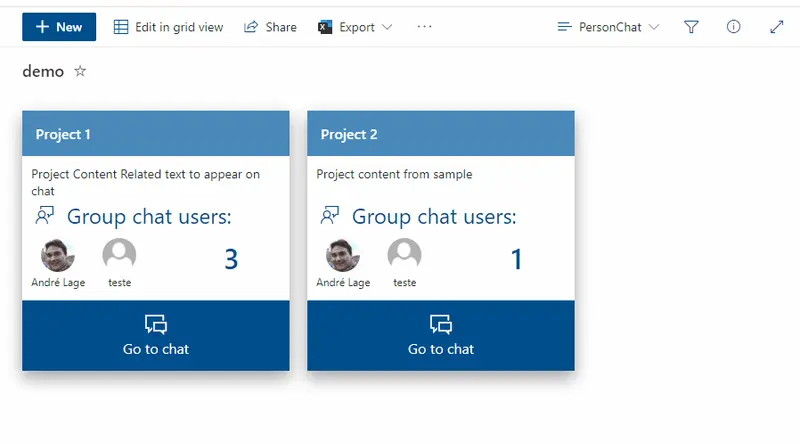
This sample uses Microsoft Teams deep links to create Teams chat group based on selected users with associated Group name and message.
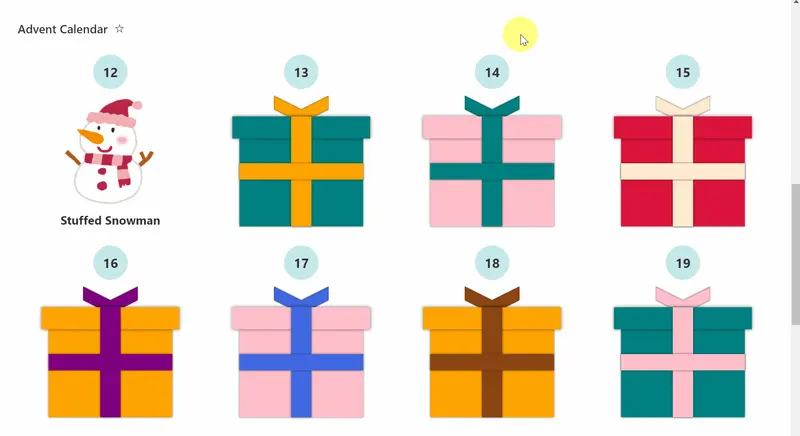
This sample demonstrates an advent calendar where you can click on the present box of the day to see the presents.
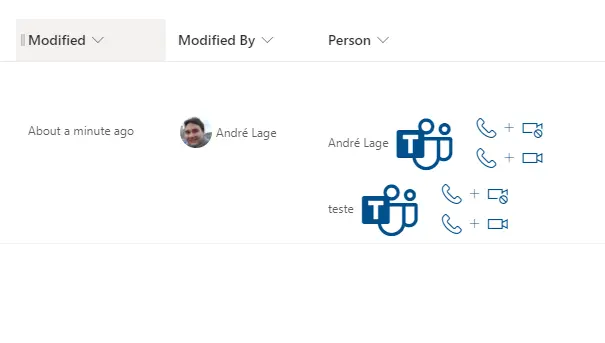
This sample uses Microsoft Teams deep links to create links from selected user that allow to make Microsoft Teams calls to user.
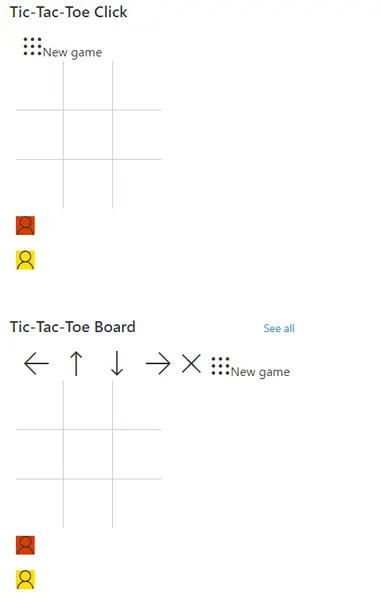
This sample demonstrates a version of tic-tac-toe using list formatting. By using the setValue action, the underlying list items are updated and the format is redrawn.
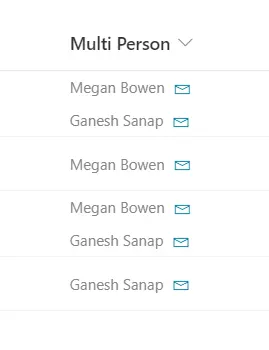
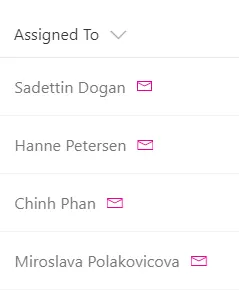
This column formatting sample demonstrates how to add a mailto: link for each person in a multiple selection person column.
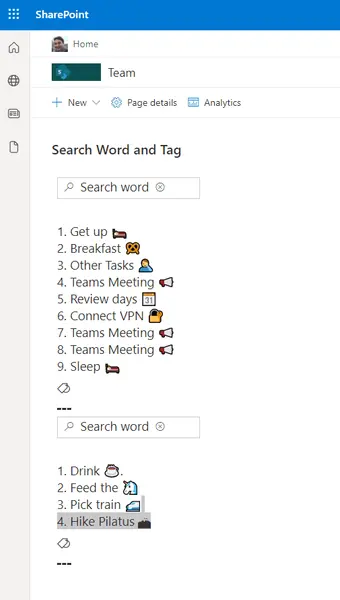
This sample demonstrates using inlineEditField to enable searching for a word against tags (choice column) within a list item.
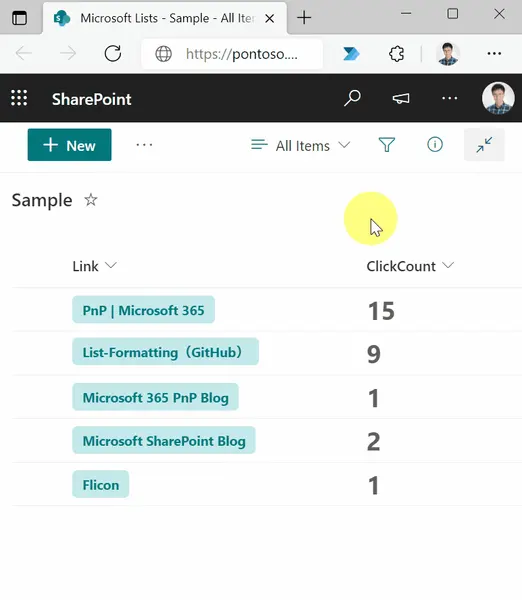
This sample demonstrates counting the number of clicks on a link.
This sample demonstrates how to change the color of the icon according to the value of the Yes/No column.
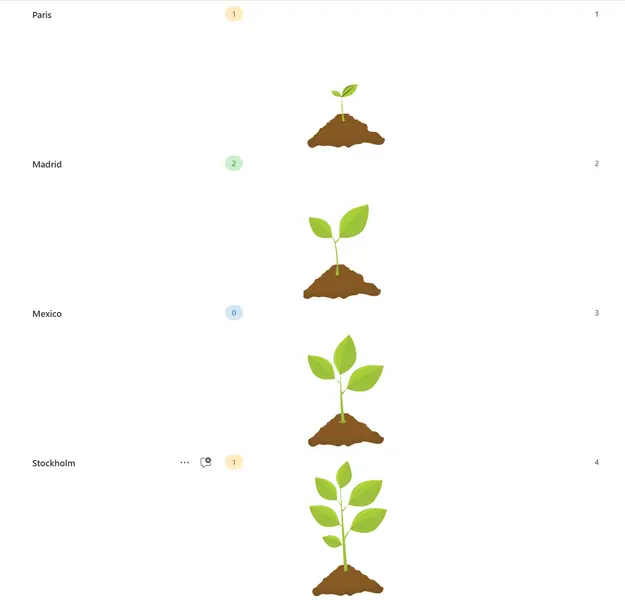
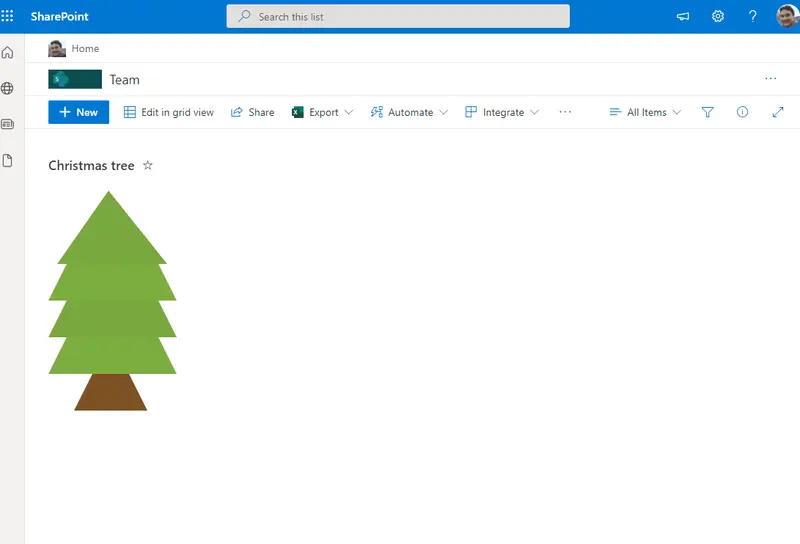
This sample draws a tree across rows in 3 different stages 'alt' as top, 'body' as tree and 'wood' as bottom. You can also include icons in the tree. The Title field will appear as a tooltip on the icons.
Demonstrates updating a date value directly from the format.
Demonstrates multi-level progress bars, randomization, handling image fields, setValue actions, and inlineEditField
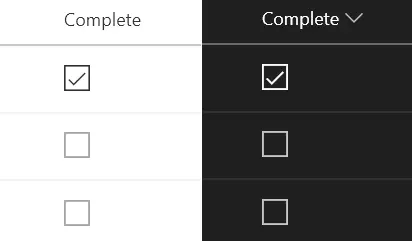
This sample includes custom checkbox rounded styles.
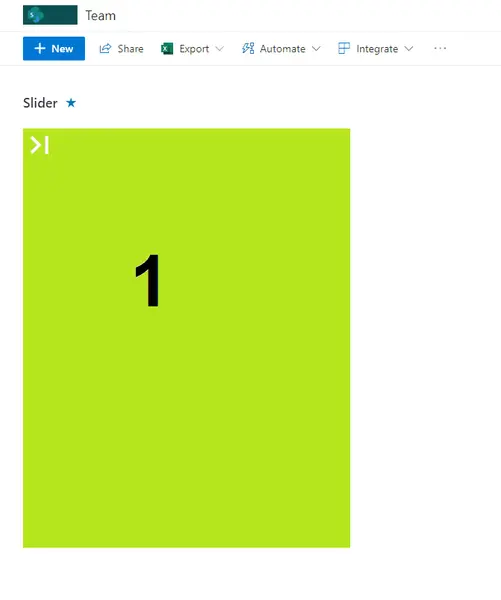
This sample includes format to display images in Lists as slider moving to next clicking the icon on top left of image.
This sample displays a formatted card in a board view that enables tagging, updating card dates, menu options to reorder cards within their category, sharing links, flaging (focus colors), assigning a user, and minimizing/expaning the card.
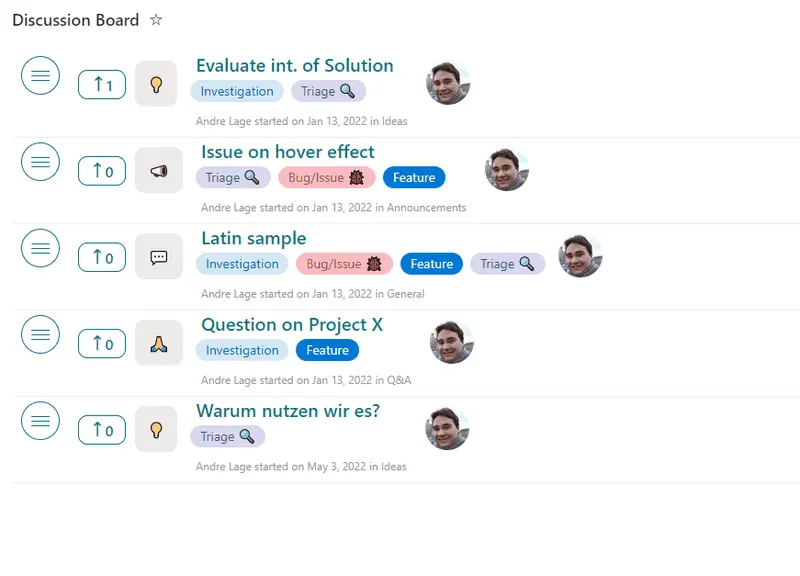
This sample transforms your list into a discussion board with title, desription, tags, and votes are available. Additionally, users can react, comment, and perform inline edits!
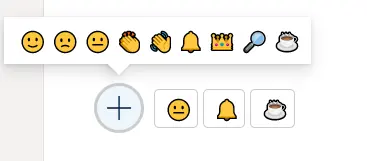
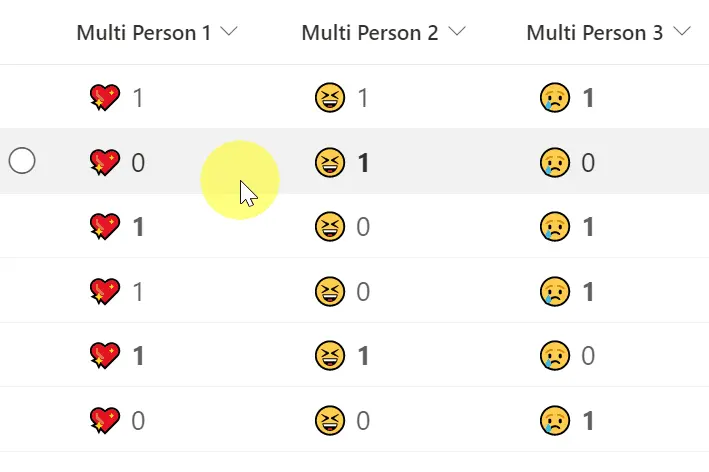
This sample demonstrates reacting with an emoji. Who reacted and the total counts per reaction are stored with the list item.
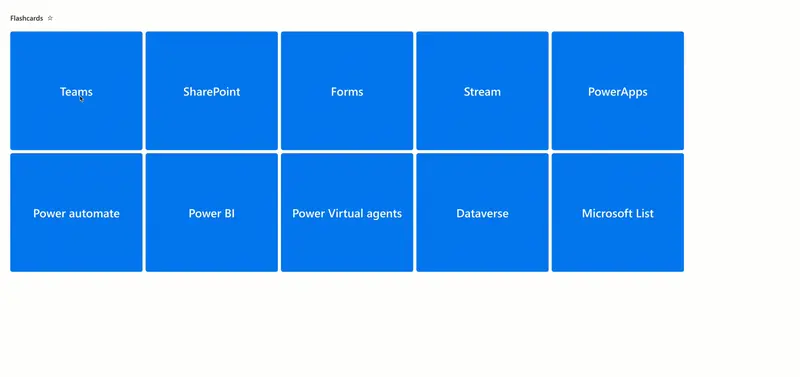
This sample creates a set of flashcards from list items. A flashcard is a card bearing information on both sides, which is intended to be used as an aid in memorization. Each flashcard bears a question on one side and an answer on the other. Flashcards are often used to memorize vocabulary, historical dates, formulas or any subject matter that can be learned via a question-and-answer format.
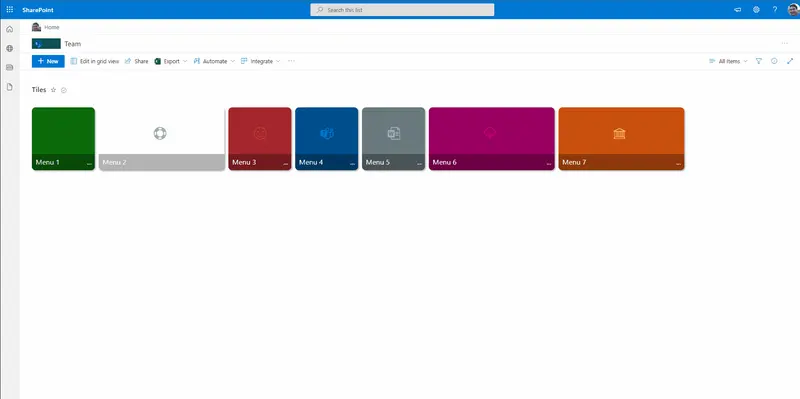
This sample includes a Metro tiles style menu with additional features such us configuration of tiles using size and color, option to favorite a tile using setValue, and also includes customCardProps to show a custom hover card with the description of a tile.
This sample demonstrates showing additional properties for a grouped user field in the group header. The user's picture, email, title, and department are all shown.
This sample provides rounded images for each person in a multi-select person field.
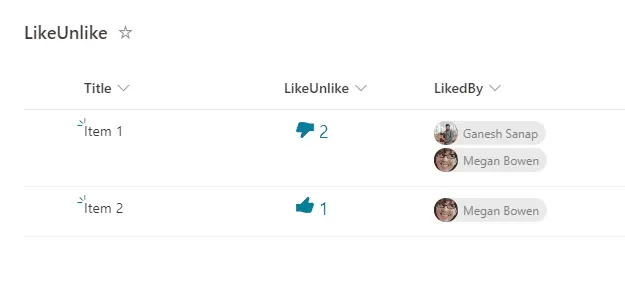
Demonstrates how to like/unlike a list item.
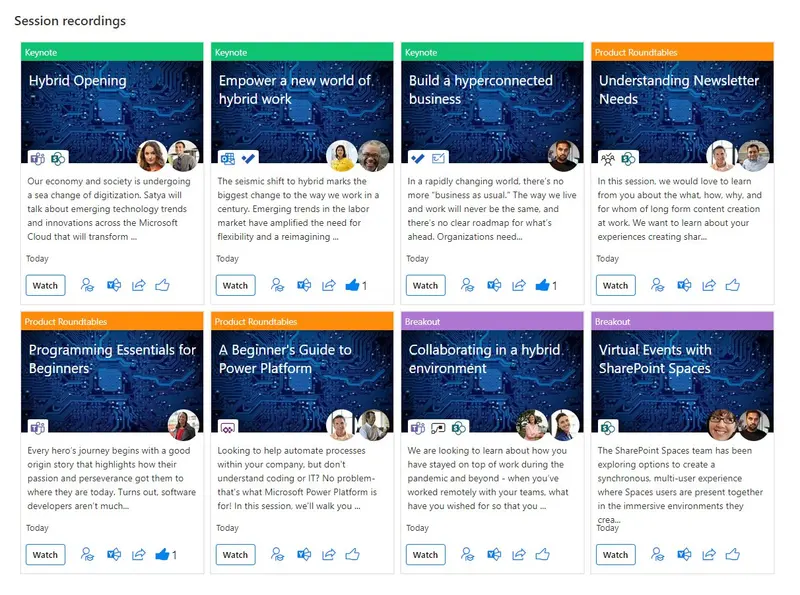
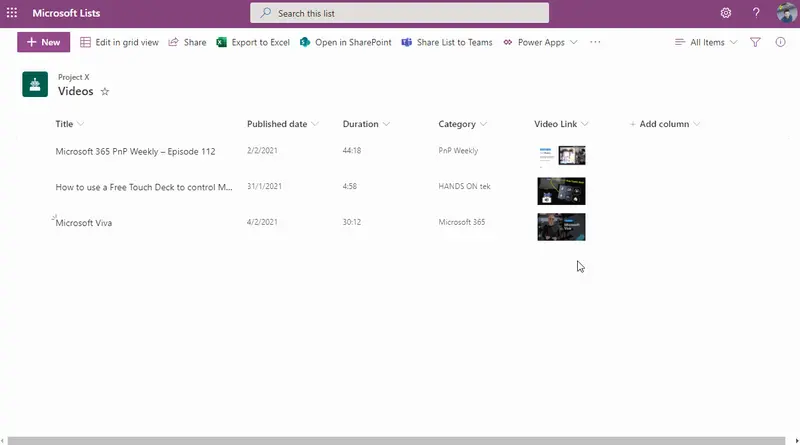
A gallery view of video stored in SharePoint with a card layout showing rich metadata such as title, description, people, tools topics covered, social sharing options like yammer, share and like.
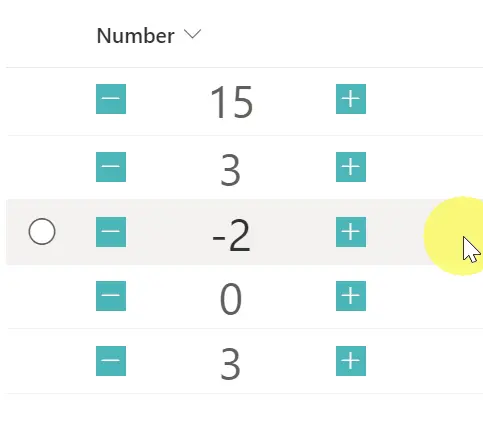
This sample demonstrates a button with a number increasing by one and a button with a number decreasing by one.
This sample demonstrates how to react and display users who have reacted.
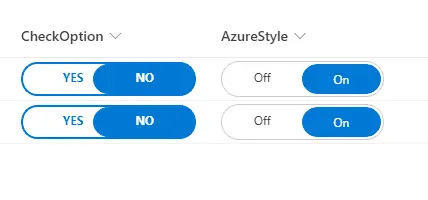
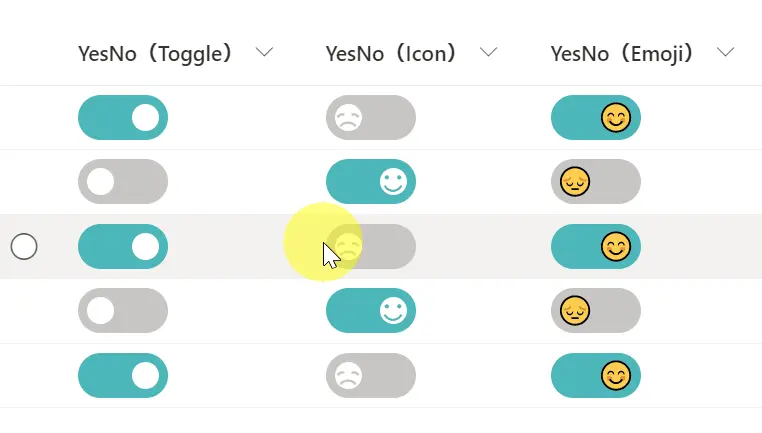
This sample demonstrates changing the value of the Yes/No column to a toggle. Three different versions of the sample are provided (Toggle, Icon, Emoji).
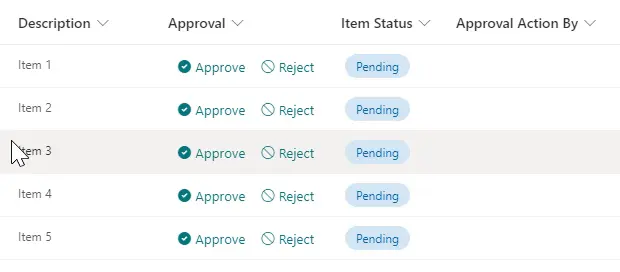
Creates buttons to approve/reject an item by updating an Approval Status field created using a choice field, and also set the value of a person field to the user who took the action by using the setValue action.
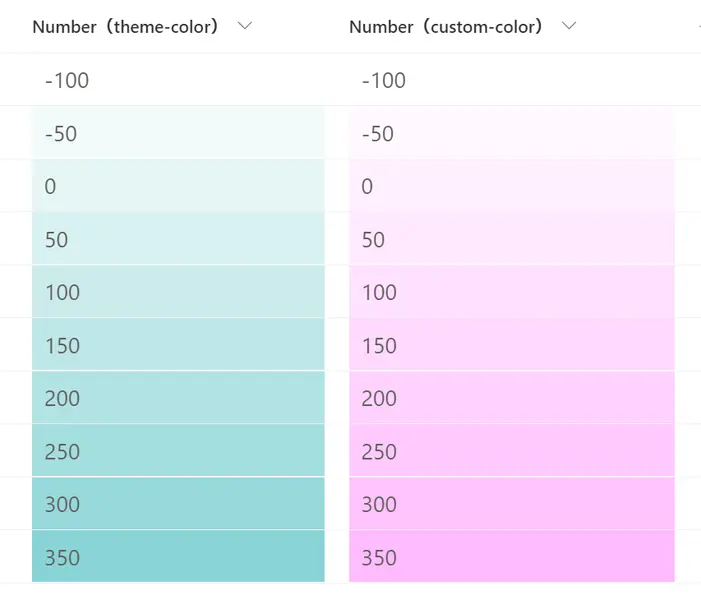
This sample demonstrates how to change the shade of the background color according to the value of the number column.
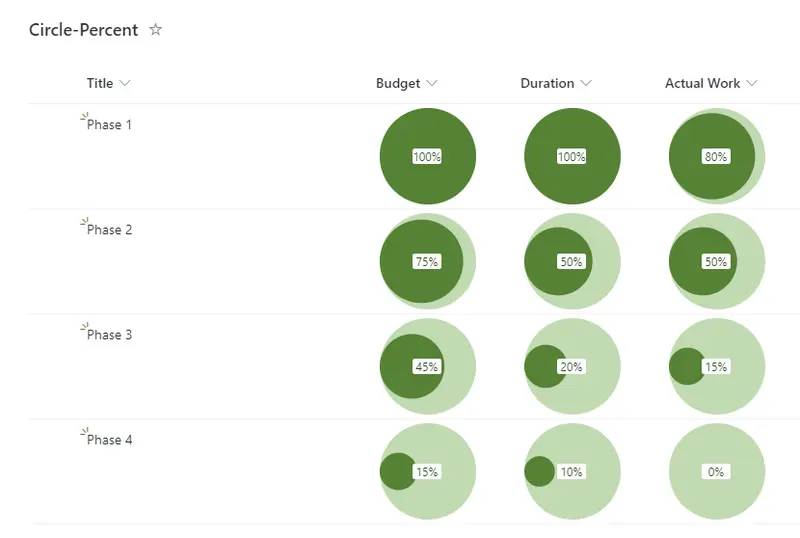
This sample shows how the percentage value in a column can be displayed as the area of a circle within another circle.
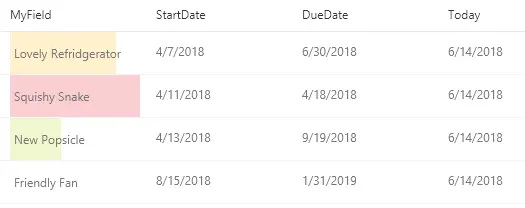
This example creates colored data bars on the current field based on `DueDate` and `StartDate` fields compared to the current date/time.
This is a sample of customizing the group header when grouping by a Status column. This format displays a different color and icon according to the Status.
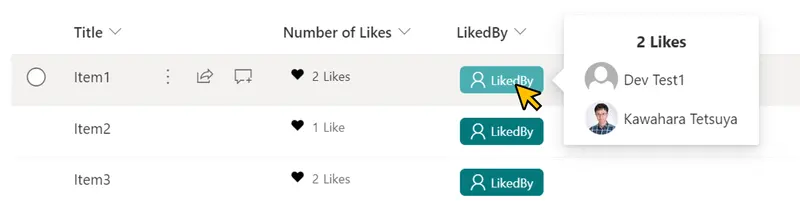
This sample demonstrates showing the users who have liked an item.
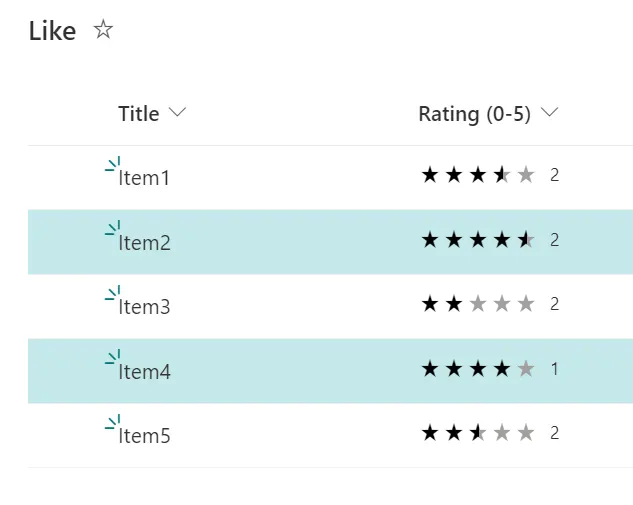
This sample demonstrates how to change the background color of a row based on Average Rating.
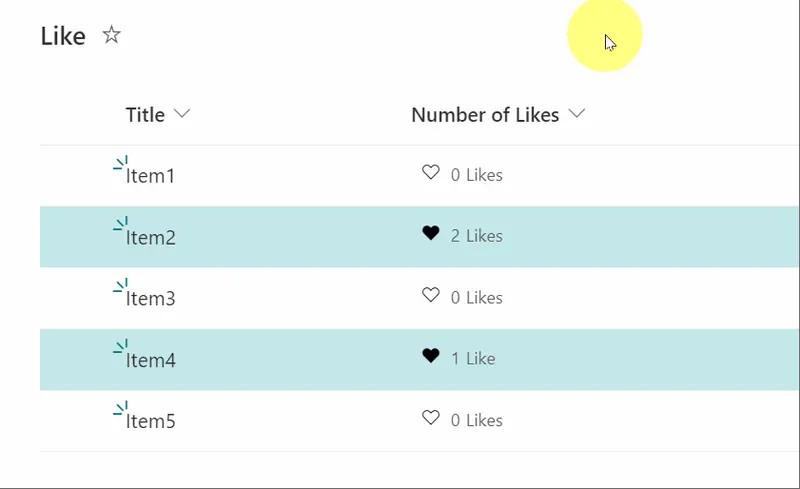
This sample demonstrates how to change the background color of a row that has been liked by the current user.
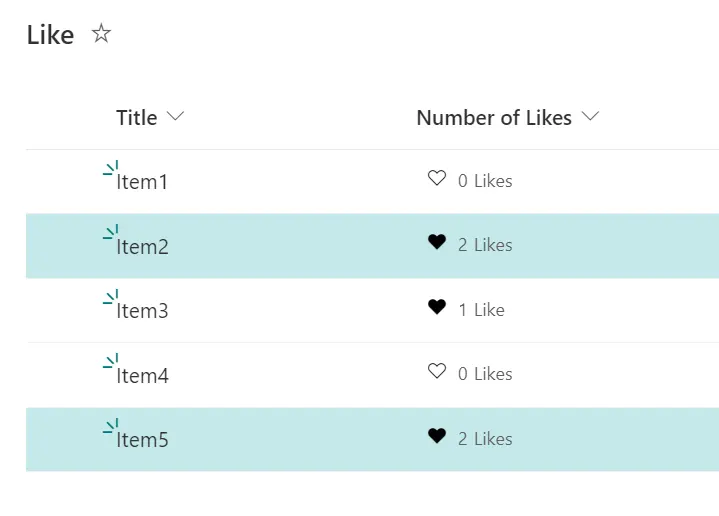
This sample demonstrates how to change the background color of a row depending on the number of likes.
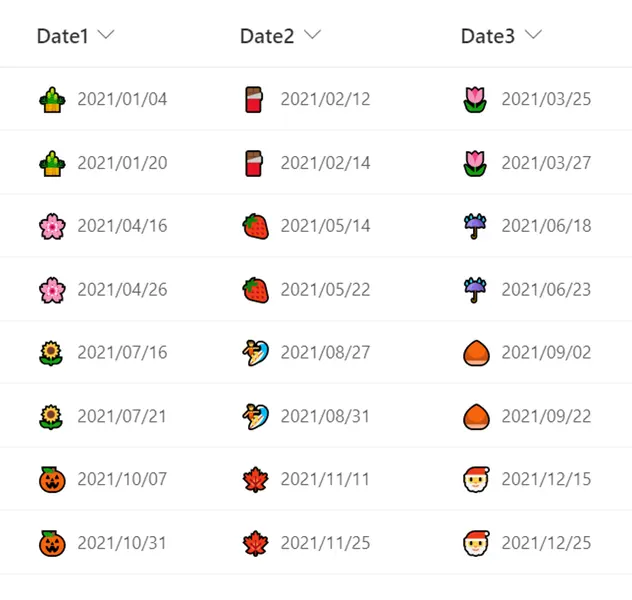
This sample demonstrates how to display a emoji representing the month of the date to the left of the date.
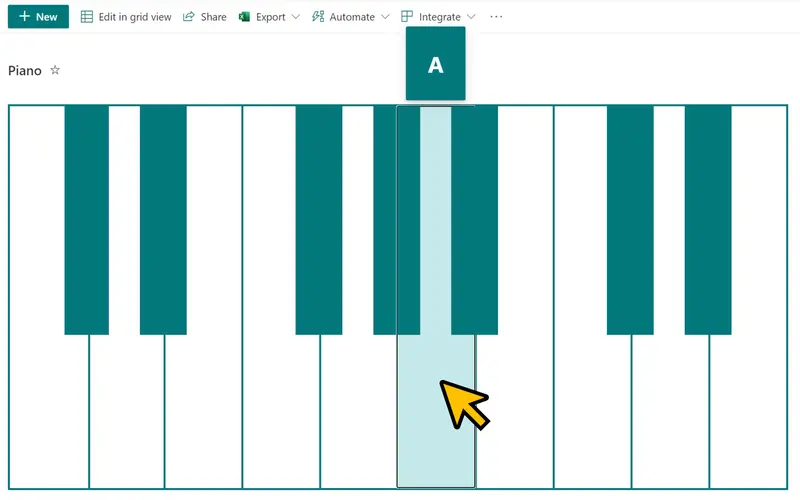
This sample formats your SharePoint list view to look like a piano.
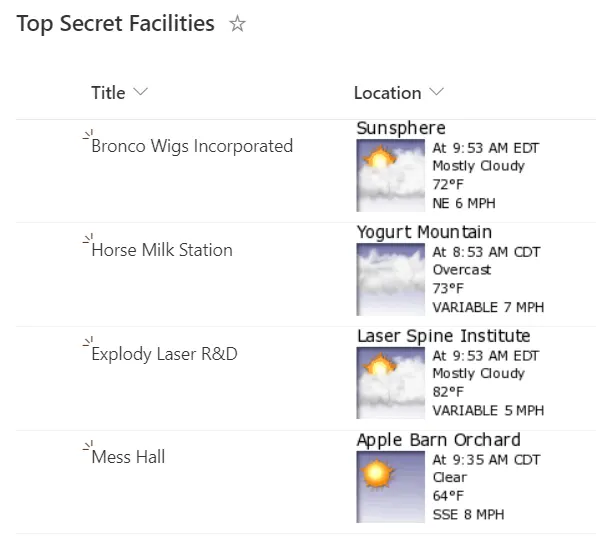
This sample utilizes sub properties of a Location column to build an image that pulls weather from WeatherForYou.com
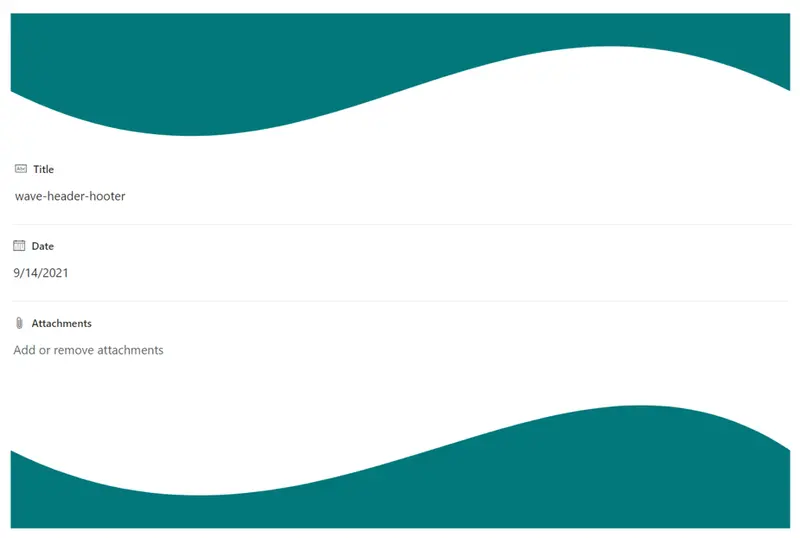
This sample demonstrates how to display waves in the header and footer of a form. Waves are displayed using SVG.
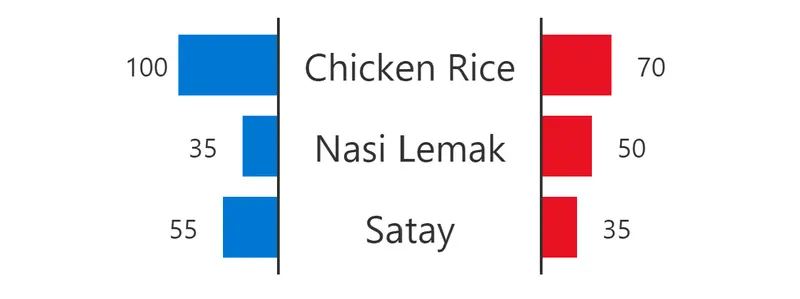
Format a list view into a chart that shows a comparison between two entities against various attributes
This is a very basic sample that disables list item selection within your view.
Providing a direct link to an item within Power Apps is easy to do using this sample. To use it follow the instructions below to get the link to your Power App (and replace that portion of the format).
This sample demonstrates making a mailto link (opens email with prepopulated values) button that references a different field.
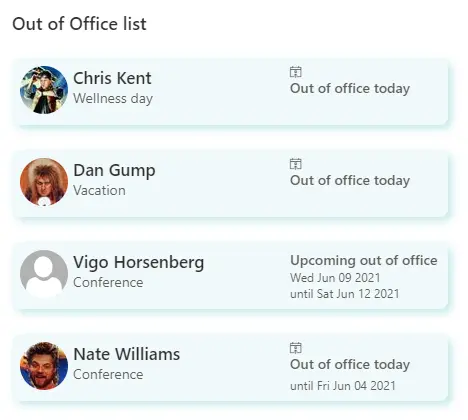
This sample shows how to format a list to show upcoming employee time away from office.
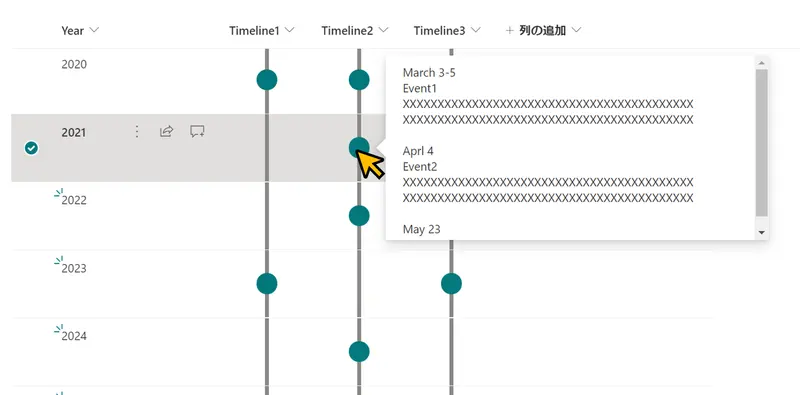
This sample demonstrates displaying a timeline in a column. If the column value is empty, no circle will be displayed. The content of the column will be shown in a popup when you click on the dot.
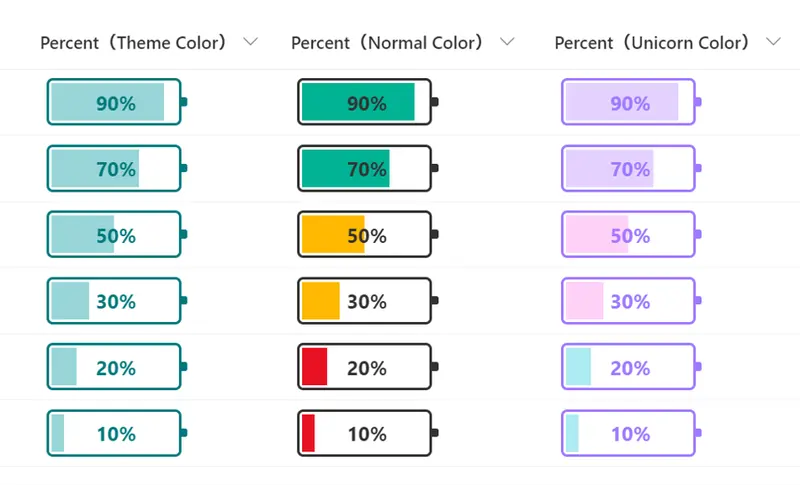
This sample changes the appearance of the values in number columns (percent) to look like a battery.
Demonstrates using a multi-choice column to create multiple links
This sample demonstrates a link collection using Emoji and is a customization of the Gallery layout. Additionally, this sample combines group customization with a tile format.
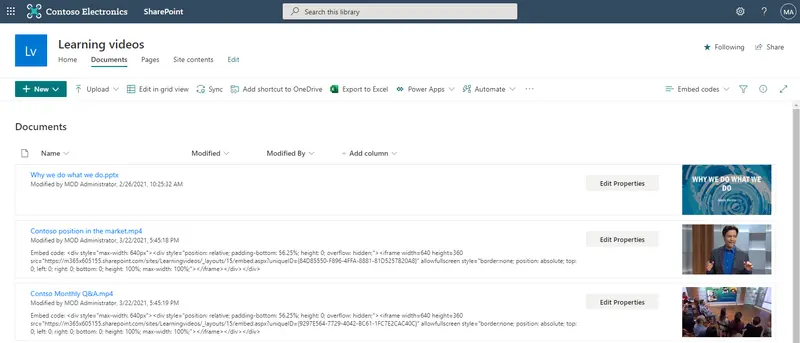
If you upload video files to a SharePoint document library, there currently isn't a way for an end user to easily get the iFrame embed code for the video file other than using the Microsoft Graph Preview item API. This document library view formatting example composes the iFrame embed code automatically for any video files in the library so users could easily copy and paste it.
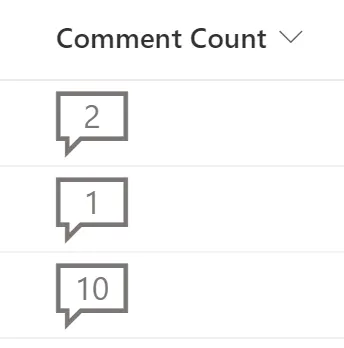
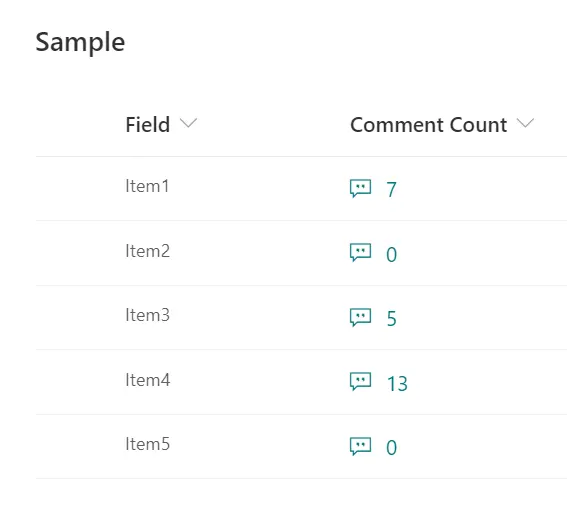
This sample adds a visual indicator to a list item, showing the number of comments present on it.
Adds a hover card with additional details when using Content Approval
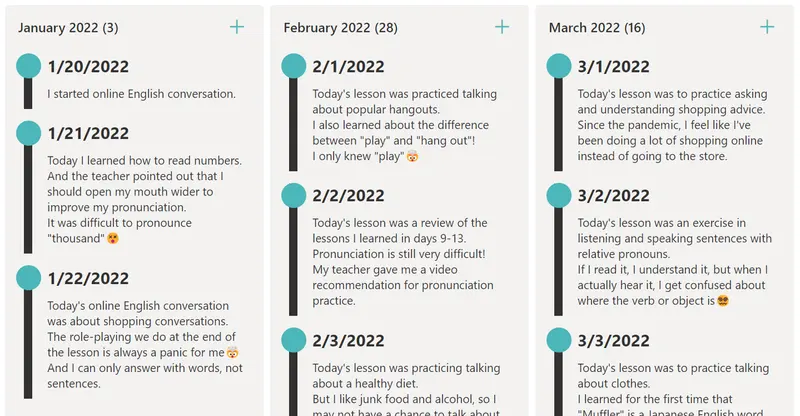
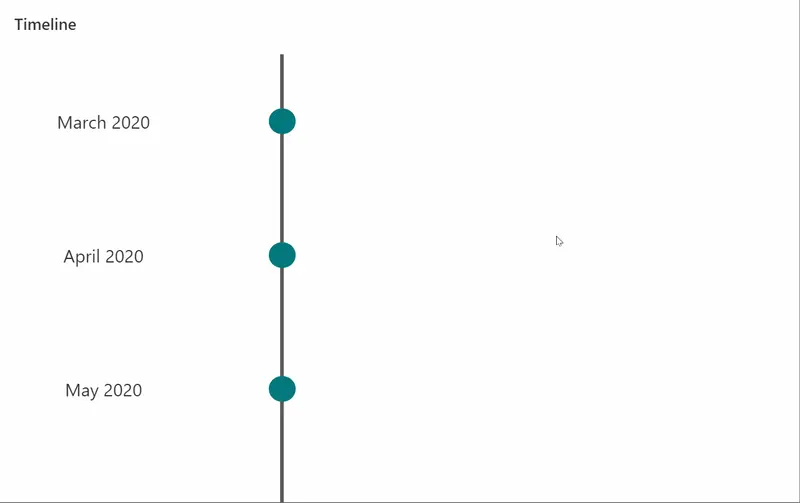
This sample formats your view to look like a chronological timeline.
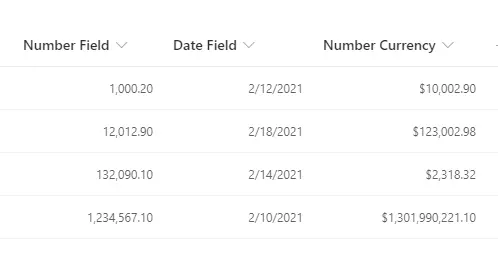
This sample shows how to right-align your content, while preserving the number or date format set using the SharePoint / Lists UI. Numbers and dates should typically be presented as right-aligned, for improved readability.
This sample provides a thumbnail of a YouTube video that links to the video and a larger preview image on hover.
This sample displays the Title and Description values in the heading and decorates them with dashed lines. If the Description value is empty, it will be hidden.
This sample formats a SharePoint list view into a butterfly chart.
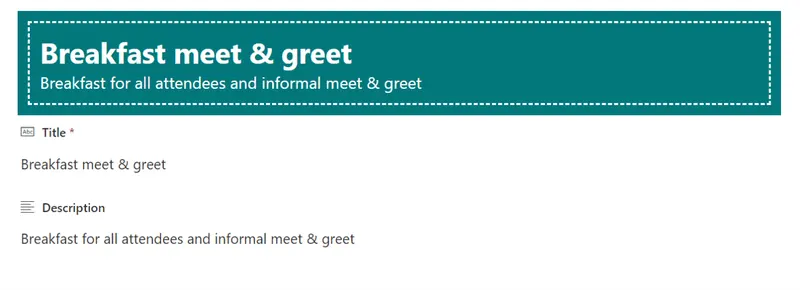
This sample shows a customized header for the item form used in the "Event itinerary" list template.
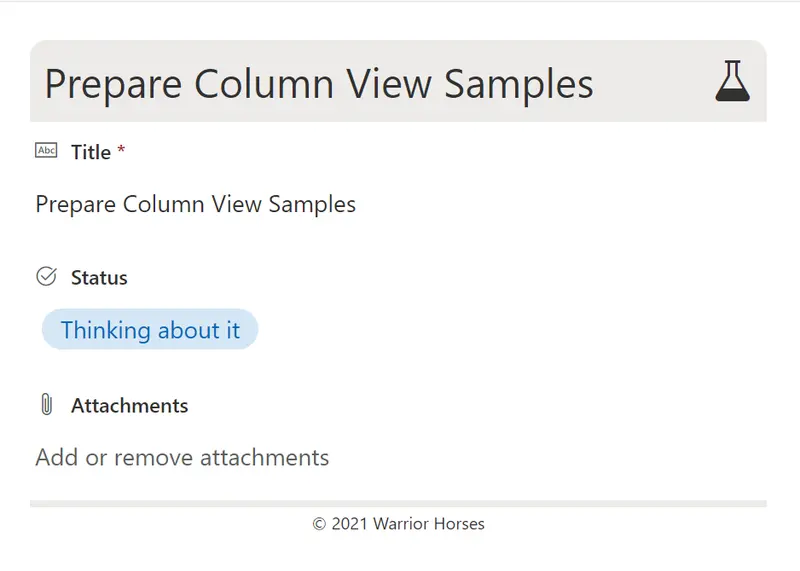
This sample shows a customized header and footer for a form with a Status column with possible values 'Thinking about it', 'Working on it', 'Done', and 'Nevermind'. This format is intended for the Header Format and Footer Format of the form body in the Configure Layout panel. Depending on the value of the Status column, a corresponding icon and colour scheme are used.
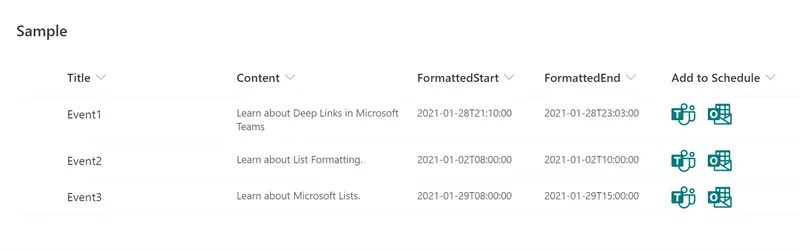
This sample demonstrates creating deep links to the scheduling dialog in Microsoft Teams and Microsoft Outlook.
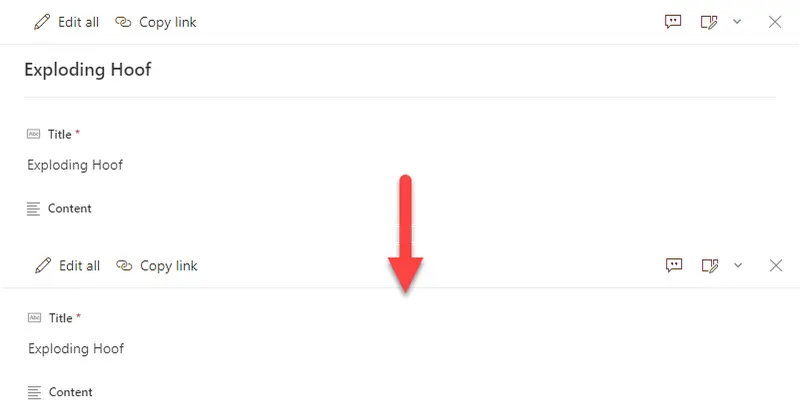
By default, uncustomized list forms display the Title field at the top. This is generally fine, but sometimes you may not want this (especially since the default is to repeat it as the first column). This very basic format removes the default Title display giving you a cleaner form.
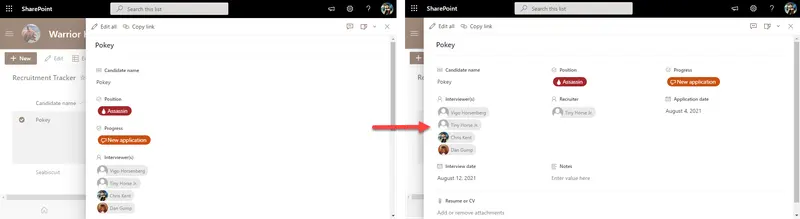
By default, uncustomized list forms display the fields in a single column. This is generally fine, but sometimes you may want to use more horizontal space and have your fields wrap. This is not technically a format but rather a body layout. No columns or sections are specified meaning that this can be applied to any form and it won't change the order of display or what columns are visible it simply adds the wrapping.
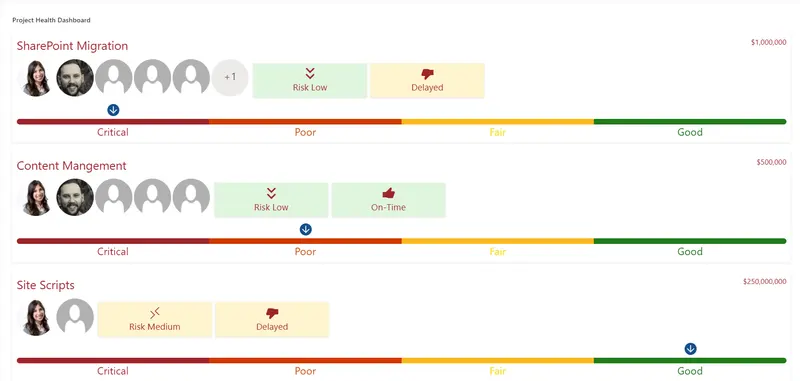
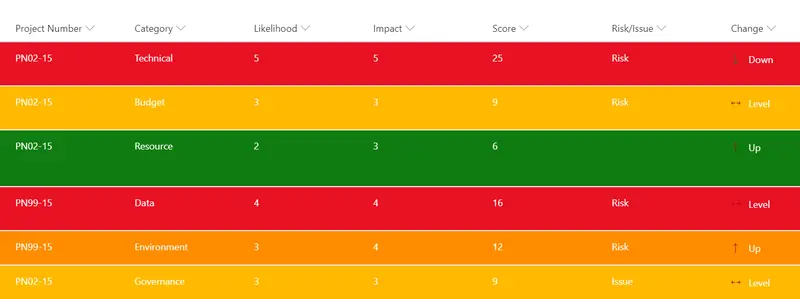
This is a template for Project health statuses; it has nice features such as Risk scoring, Severity of the project, Schedule timing, Hover effects that provide the latest project updates, Theme Colors, Project Team members, and the cost of the project.
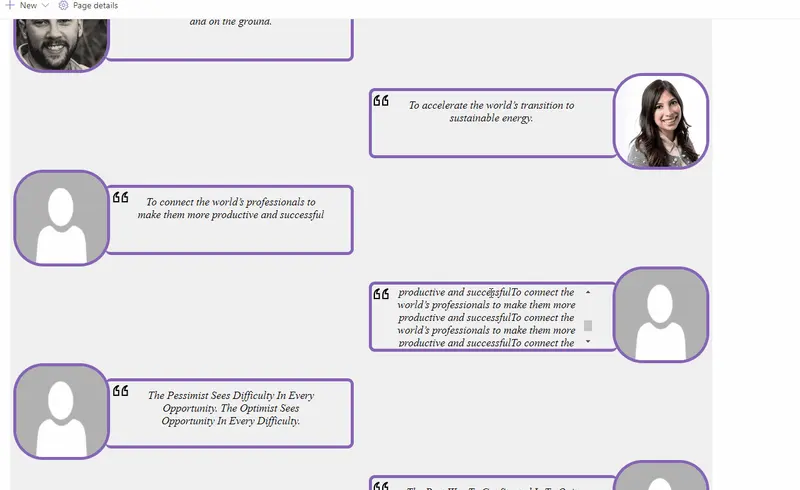
This is a template for testimonials (Business Statements), it has nice features such as directional messages, styles, utilizes the current theme colors, image persona hover card, overflow logic and even has some SVG Magic! 🙌
This sample shows the comment count for a list item.
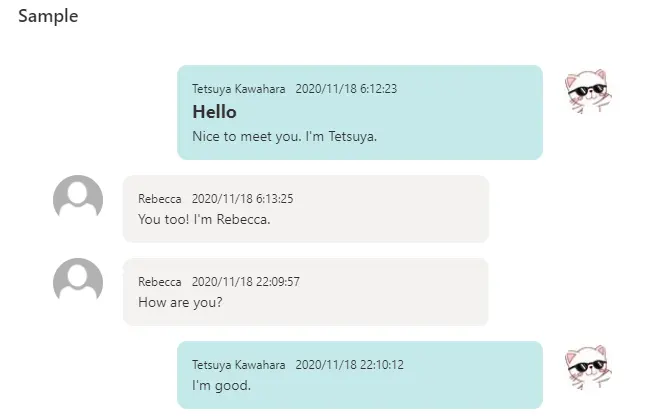
This sample formats your SharePoint list view to look like message chat bubbles! If the Author is the current user, the message will be displayed on the right.
This sample formats your SharePoint list view to look like a timeline.
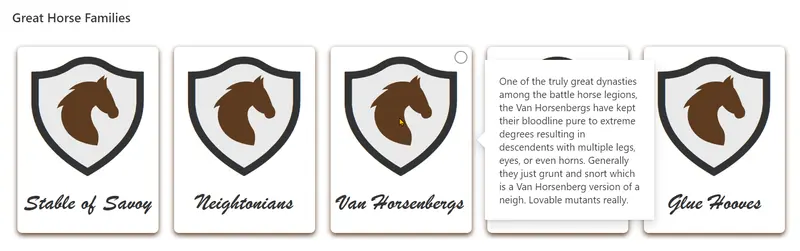
This sample illustrates some advanced techniques for applying theme colors to SVG elements, box-shadows, and borders. It also demonstrates using custom hover cards on complex elements (elements with children).
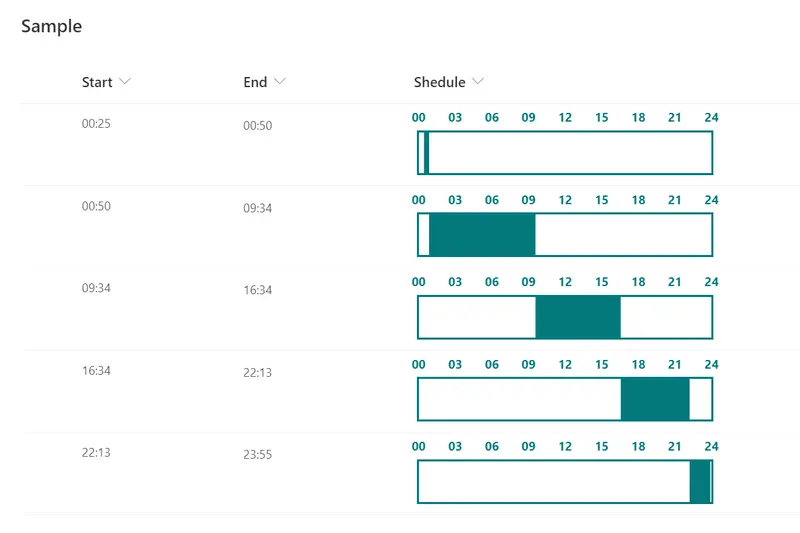
This sample demonstrates a time schedule with a filled background from Start time to End time.
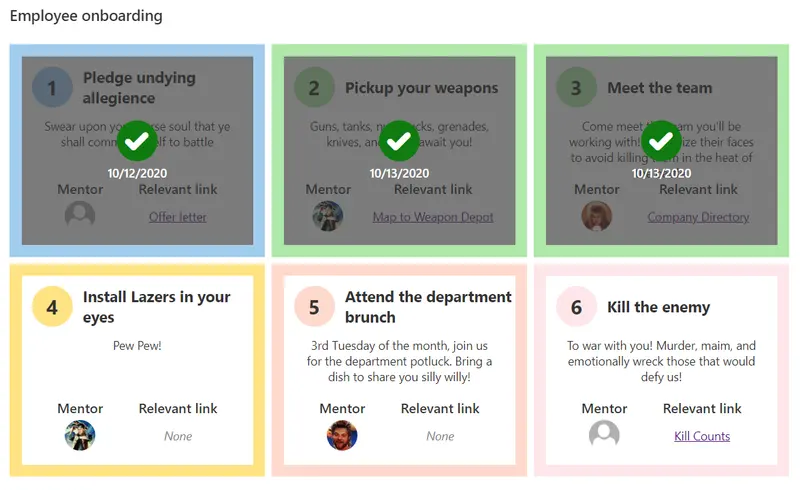
This sample is intended to be used in combination with the Employee Onboarding list template. The format restores the intended alternating rows but also adds a Tiles view that provides a more step based approach.
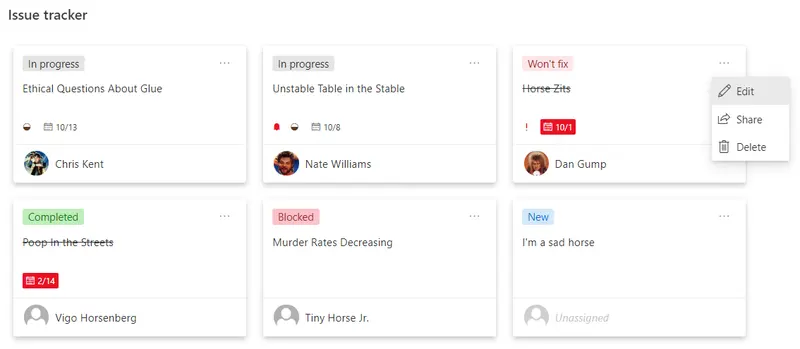
This sample is intended to be used in combination with the Issue Tracker list template. The format keeps the row highlighting for blocked issues but also adds a Tiles view that provides a Microsoft Planner look and feel.
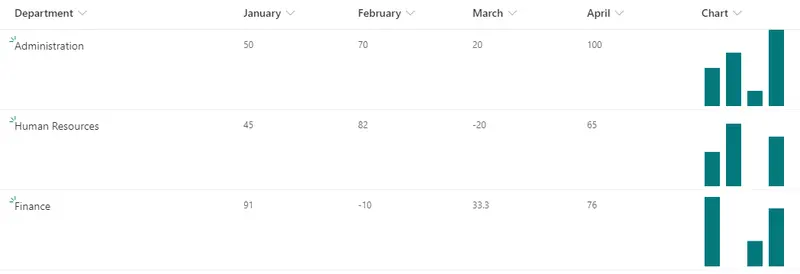
This sample demonstrates displaying a column chart using SVG. It uses the `currentColor` for the fill value of the SVGs which allows us to use a theme class to make the final SVGs fit your site's theme.
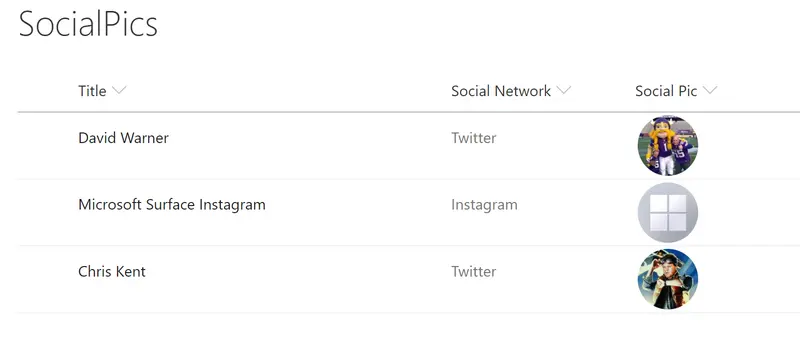
Social media profile pictures are displayed in a circle and clicking them will open the user's social media page in a new window..
This format demonstrates how you can reproduce the status choices as pills found in the Microsoft Lists Issue Tracker template..
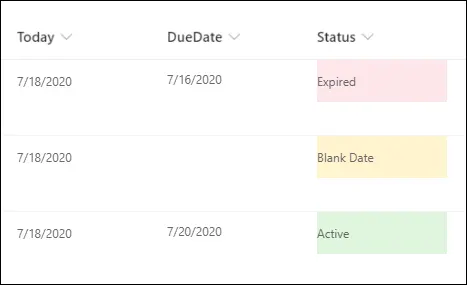
This example populates the text content and applies different classes to the Status field depending on the value inside an item's DueDate field. This example applies formatting to one field by looking at the value inside another field. Note that DueDate is referenced using the `[$FieldName]` syntax. FieldName is assumed to be the internal name of the field. This example also takes advantage of a special value that can be used in date/time fields - `@now`, which resolves to the current date/time, evaluated when the user loads the list view.
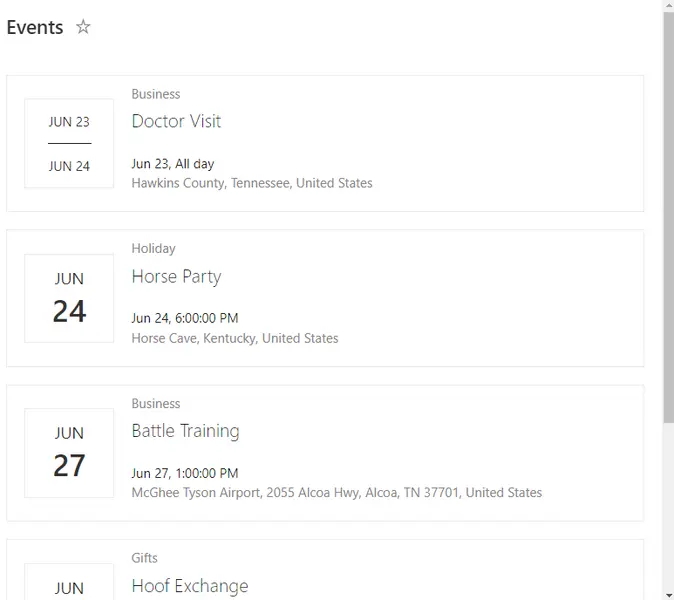
This sample demonstrates applying view formatting to an Events list to imitate the modern events webpart.
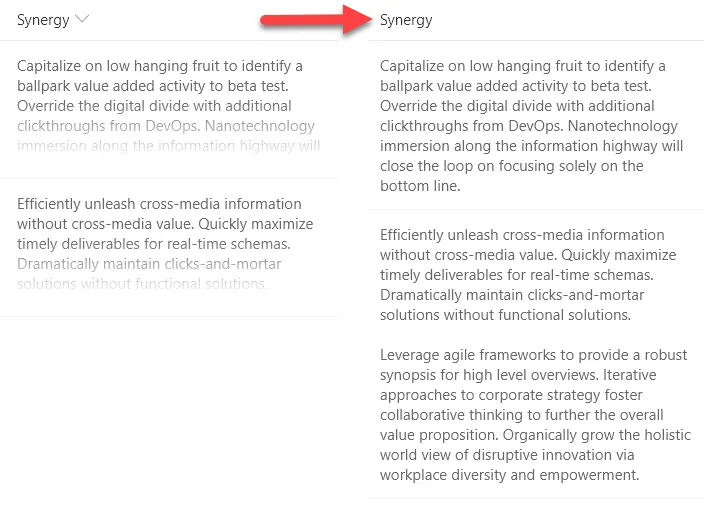
With modern document libraries and lists, lengthy multi-line fields no longer show text in full (a fade is provided). This isn't always desired, so this sample demonstrates rending long text to mutilple lines with word wrap, similar to classic mode.
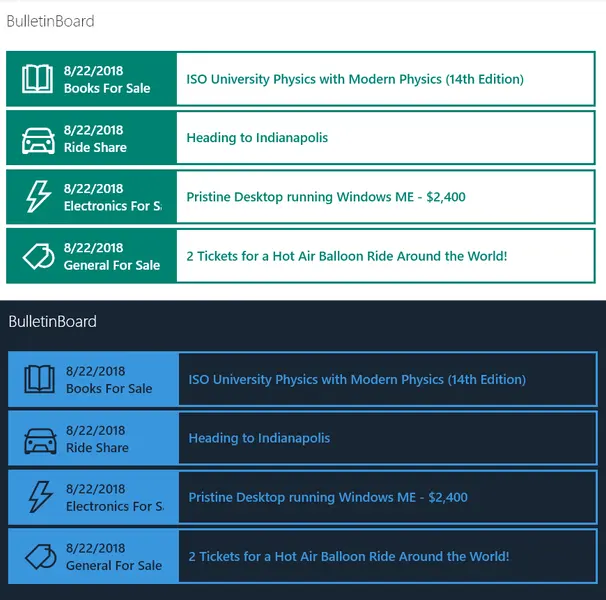
Provides an example of creating a simple bulletin board listing. The rowFormatter property is used to fully customize the display of rows to create a nice view of list items while easily allowing users to click on the item for additional details. The large size and use of icons makes this much more attractive than a simple table view and keeps the functionality simple for users.
A custom card is shown on hover of an item. The hover card shows additional details about an item's status.
This sample demonstrates showing a default hover card in a document library. On hover in a formatted view on a file a file card is displayed. On hover in a formatted view on a person column a profile card is displayed.
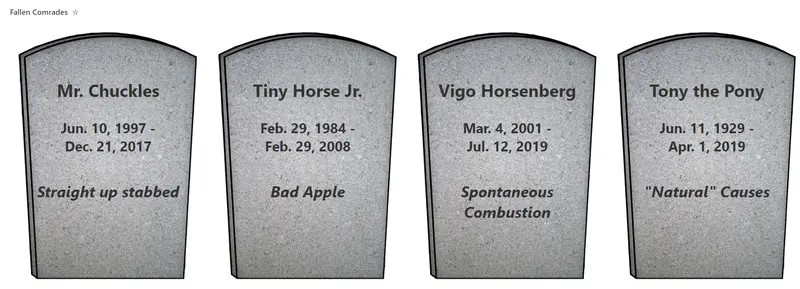
This is a silly sample that shows tombstones for items. It demonstrates custom date formatting, custom tiles (gallery) layout, and safe local image referencing.
Demonstrates the use of dynamic connections in the list webpart while using a custom format. This results in a custom video selection application that changes the embeded video on the page.
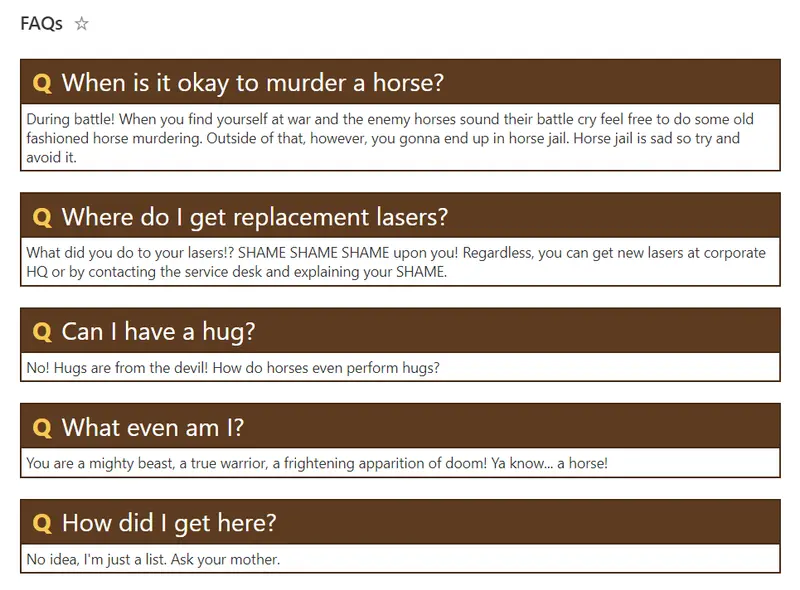
This sample creates a theme-aware format to use when displaying FAQs (Frequently Asked Questions).
Sometimes it is necessary to remove the standard headers. In those cases, you may still want to show a custom header. This sample demonstrates creating a custom header and only showing it on the first row. The key to this technique is setting the `display` style attribute to `none` (hidden) whenever the `@rowIndex` is not 0 (first row).
This is a silly format that draws a picture in your view using the @rowIndex token to adjust the colors and to determine when certain pictures (icons or SVG elements) should show up.
This format demonstrates using a combination of the substring and indexOf operations to 'split' a value and make style decisions based on portions of the value.
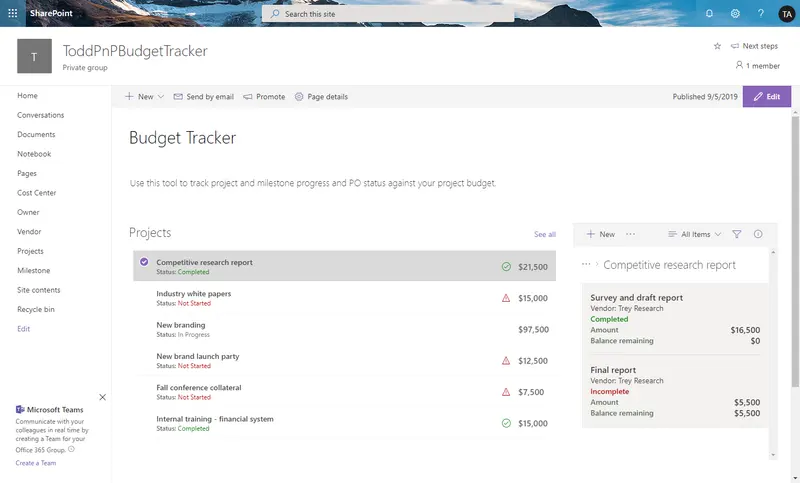
The budget tracker sample demonstrates how to use view formatting to format lists and display views of the lists inside connected web parts. This provides the ability to view the budget items associated with individual projects on a single page.
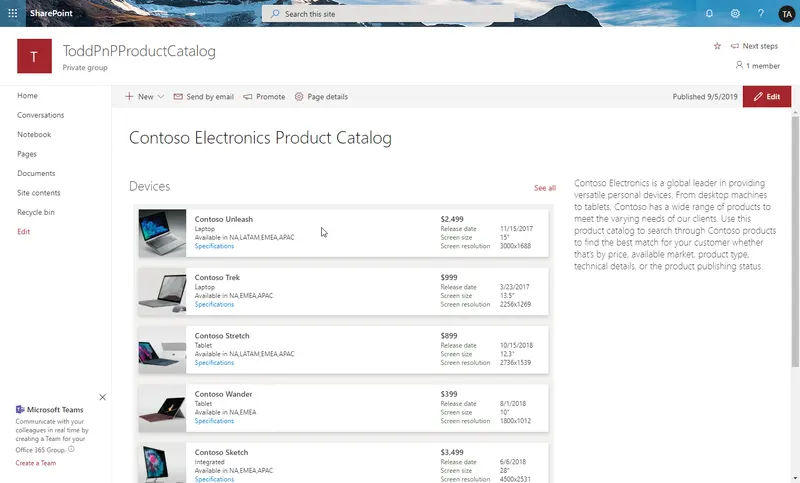
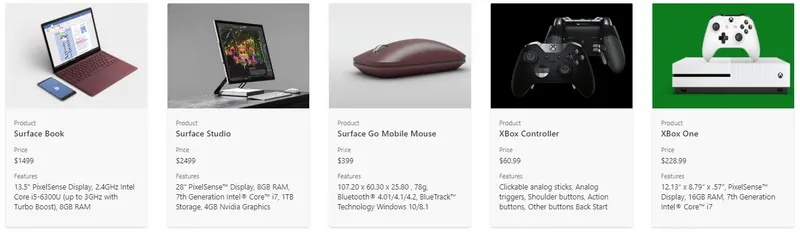
The product catalog sample demonstrates how to use view formatting to format lists and display views of the lists inside web parts. It also demonstrates how to create links to download documents from the SharePoint Document libraries.
This sample demonstrates creating a deep link to a Microsoft Teams chat. This format works both within Microsoft Teams and within SharePoint Online.
This sample provides rounded images for each person in a multi-select person field.
You can UI Fabric Icons within your column and view formats. This sample demonstrates combining multiple icons by overlaying to create colorful icons that can indicate more information than a single icon can.
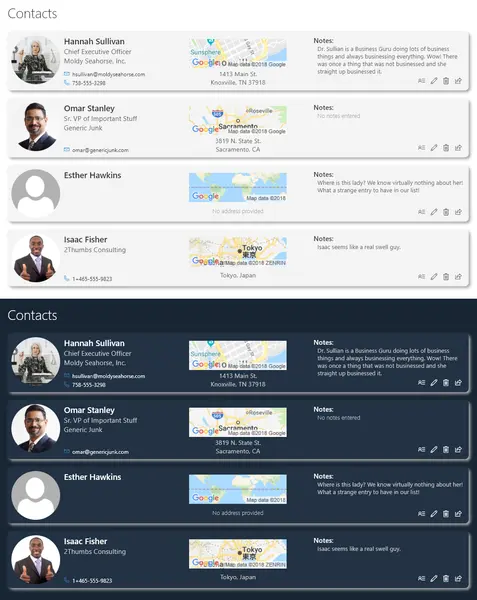
This sample demonstrates creating a basic person card. You can use this as a quick contact list.
This sample uses tileProps element to format the tile layout for document libraries.
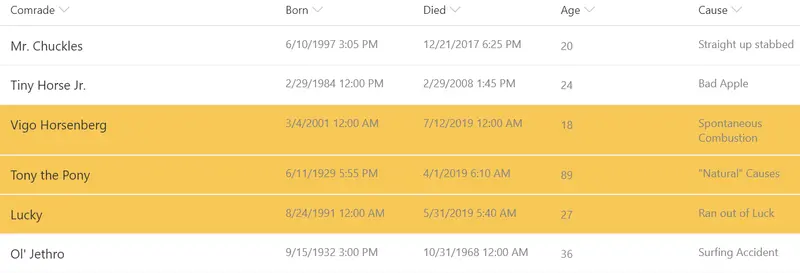
Demonstrates applying a class to rows where a value equals the current year. Can easily be updated to compare other portions of the date such as the month, hour, minute etc. by using the other date-part operators.
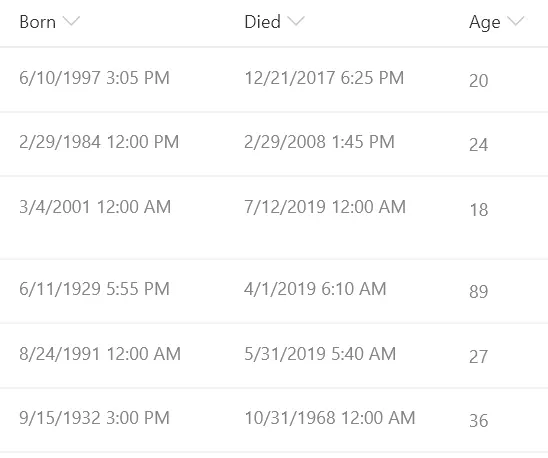
This sample demonstrates calculating the difference between 2 dates. In this sample the age in years is calculated based on the date of birth and the date of death. This format could easily be adjusted to calculate a different unit of time (months, days, hours, minutes, etc.) by adjusting the multiplier.
This sample uses tileProps element to format the tile layout of the view.
This sample shows how to format a list to show the data as a bar graph.
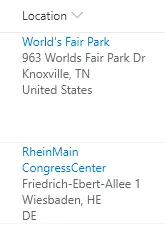
Location columns provide several properties that can be accessed to provide more information to users. This sample pulls out sub properties to turn the standard Display Name only to a full address and provides a link to Bing Maps for a given location.
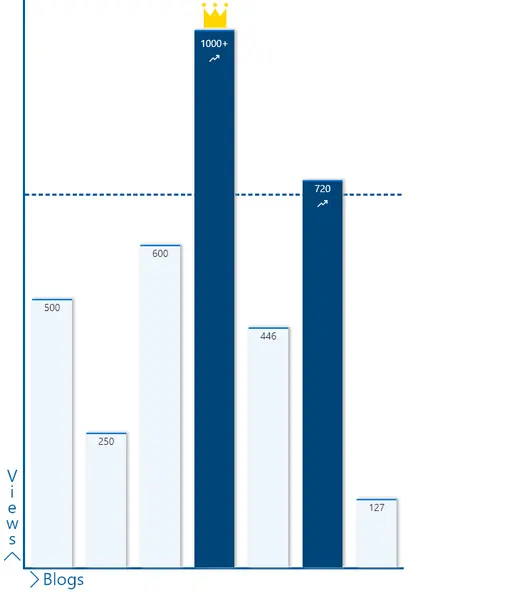
This sample shows how to format a list to show the data as a column graph.
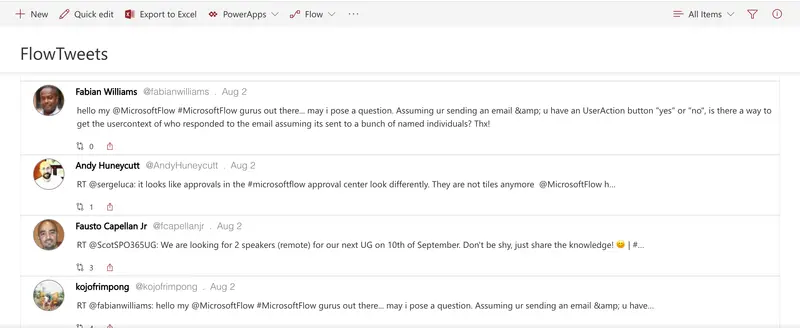
This sample formats your SharePoint list view to look like Twitter. If you are using the Microsoft Flow Templates to track tweets in a SharePoint list, this is a great way to format your list so that it looks more like Twitter.
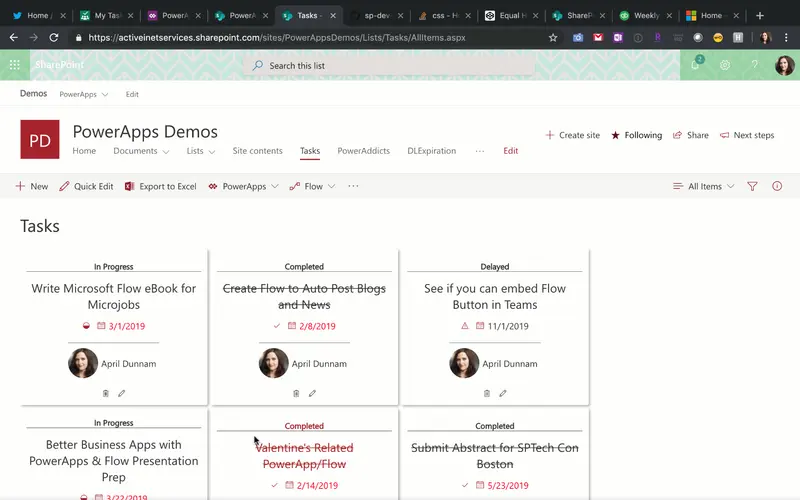
Formats Task List Items in a Planner Inspired Card View. Uses Fluent UI Icons to designate In Progress, Completed, and Delayed Statuses. Automatically strikes out text for Completed items.
This sample demonstrates combining a fixed SVG (gauge background) with a dynamic SVG (needle). It makes understanding number columns (percent) very intuitive.
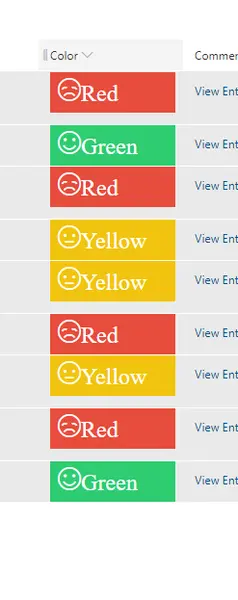
This sample displays smiley faces (emojis) based on color. The format will add a smiley face (icon) which comes from Fluent UI.
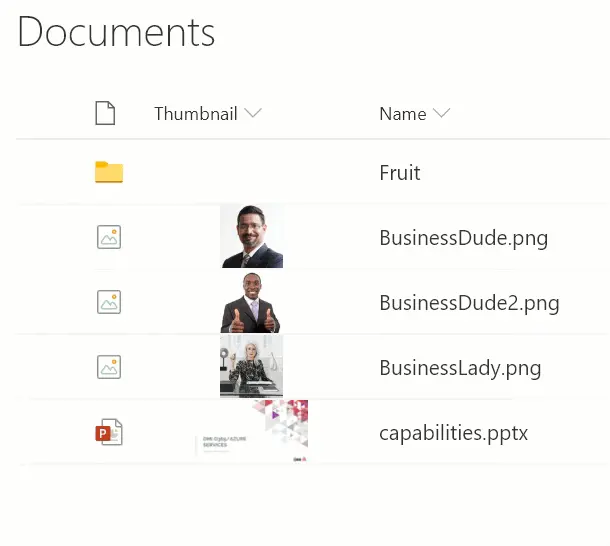
Utilizes the @thumbnail placeholder token to create an inline preview for document libraries.
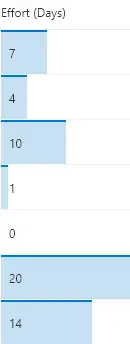
These formats apply background-color and border-top styles to create a data bar visualization of @currentField, which is a number field. These styles are applied using the special column formatting class sp-field-dataBars. The bars are sized differently for different values based on the way the width attribute of the main div is set.
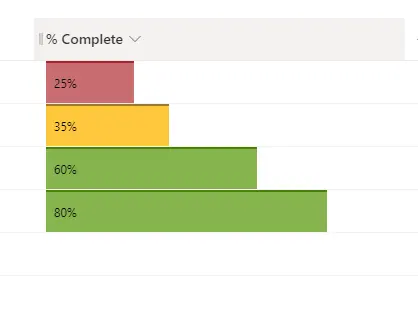
This column formatting sample demonstrates how to show the number column as data bars with multiple colors.
This example uses a column to generate a hyperlink to the Item Thumbnail for a document library.
This sample demonstrates usage of the forEach property to create template elements applied to each choice in a multi-select choice field.
You can use column formatting to create buttons that, when clicked, run Flows on the corresponding list item. The Flow Launch Panel will be displayed after clicking the button allowing the user to specify any required data and then run the flow. This is demonstrated in the Generic-Start-Flow sample.
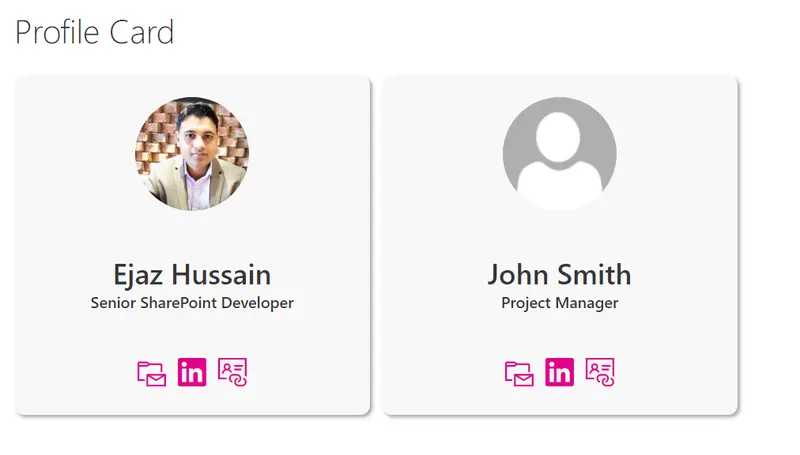
This is simple user profile card built to provide a tile view with contact buttons. A default image is shown if a picture is not provided.
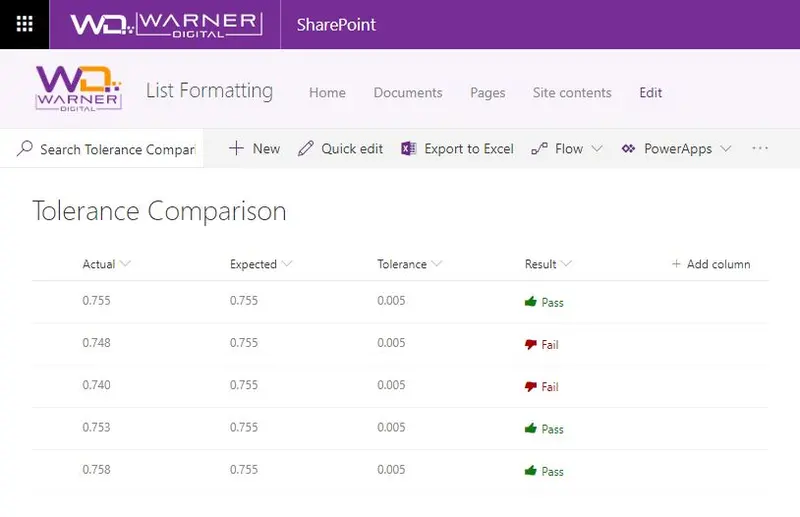
Display if a value is within the expected tolerance.
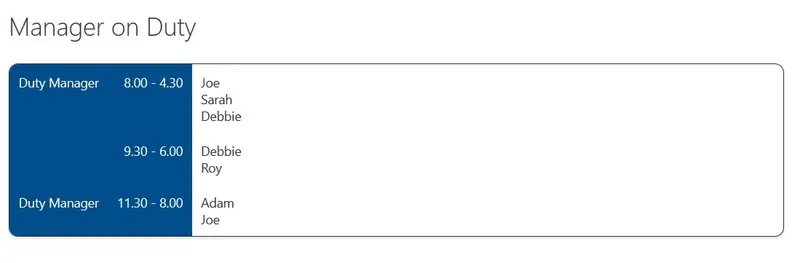
This sample demonstrates creating a Rota Shifts table using CSS Table layout by using rowFormatter to customise the entire display of a row.
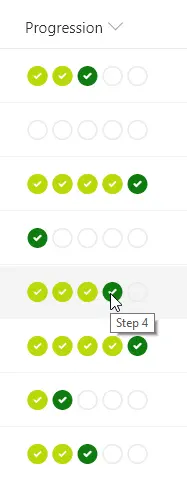
This sample demonstrates creating a progress bar using icons. The number column represents the stage in a process and the format provides a visual indicator of where an item is in relation to the process by showing the previous steps as completed, highlighting the current step, and indicating which steps remain.
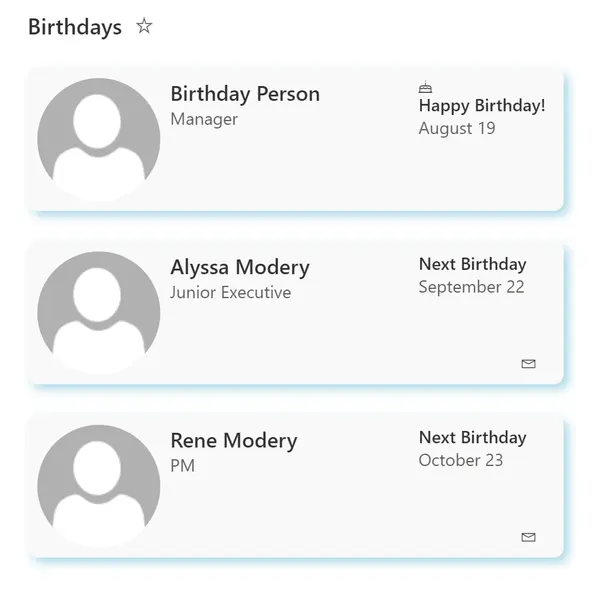
This sample shows how to format a list to show upcoming employee birthdays.
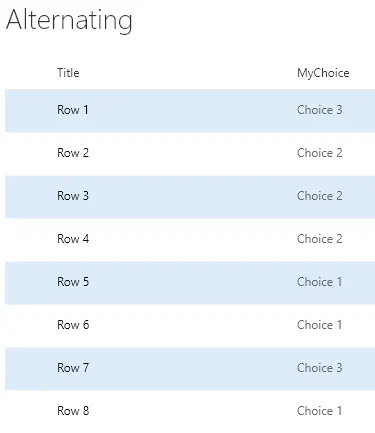
Highlights every other row using theme colors.
This sample uses the @me keyword to check if the person field contains the current user and shows that entry using a different color and weight. This is a dynamic check that will always highlight the user using the list (not the creater of the format). This template could easily be extended to apply different/additional styles or icons as desired by simply copying the same expression logic for other fields.
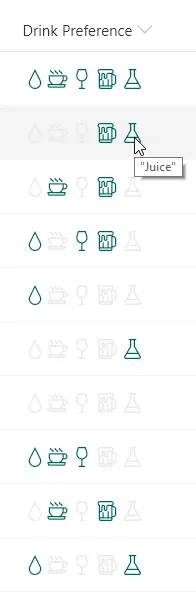
This sample demonstrates using the indexOf and join functions (O365 only) to test if a multi-select choice field has a selected choice. Providing icons of the known choices and applying themed colors based on if the given choice is selected or not creates an intuitive, easy to understand visualization that doesn't suffer from varying item order or text formatting issues.
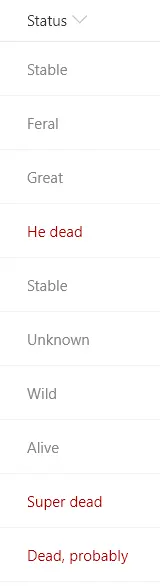
This sample demonstrates using the indexOf function (O365 only) to test if text contains a given value. The sample also uses the toLowerCase function to ensure the contains condition is case-insensitive. In this sample, if the text of the current field contains the word 'dead' a class is applied to turn the text red.
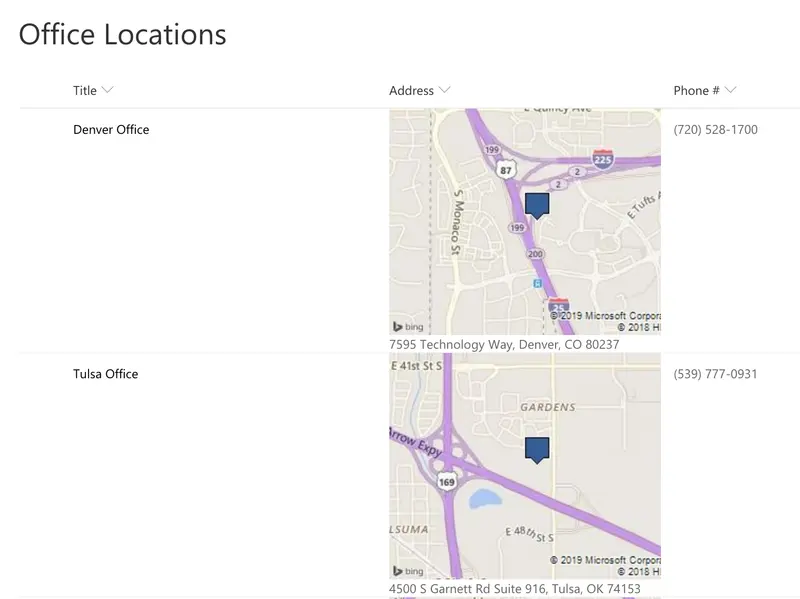
This template uses Bing Maps staticmap API which generates an image using a parameterized URL. The template only uses the most basic features of map location and image size. To see all of the available option see the static map documentation
This sample demonstrates showing files in a document libary as preview images.
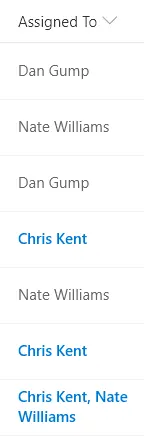
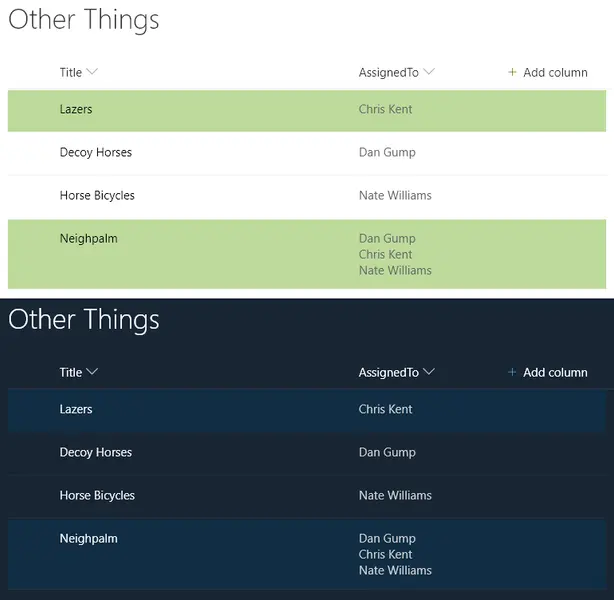
Highlights the entire row for any list items where one of the assigned to users is the current user (the user viewing the list view, not the author of the format). You can easily adjust this to use a different person column by changing the `[$AssignedTo]` portion of the expression.
This sample demonstrates basic row display with conditional logic to adjust the background-color based on a Status field.
Provides an example of customizing your format based on the item's content type. When an item's ContentType is Apple and the apple type is Green then green is used in the format. If it's Apple with a different type, red is used. Otherwise, orange is used.
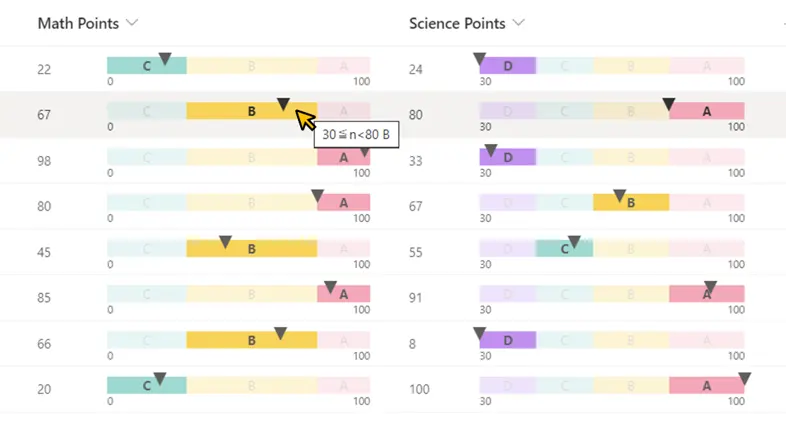
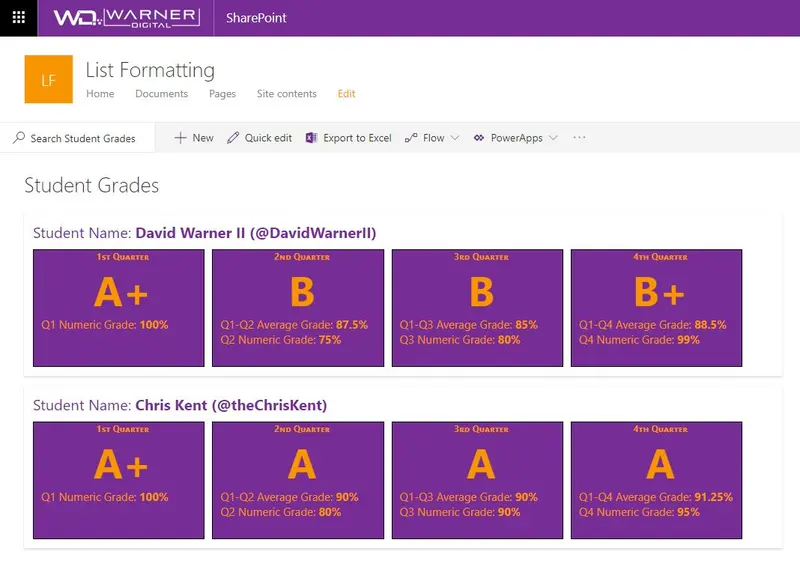
Provides an example of comparing numeric values across time periods. In this example, we are using grades for students across 4 quarters, though the principle can be applied to any repetitive numeric values.
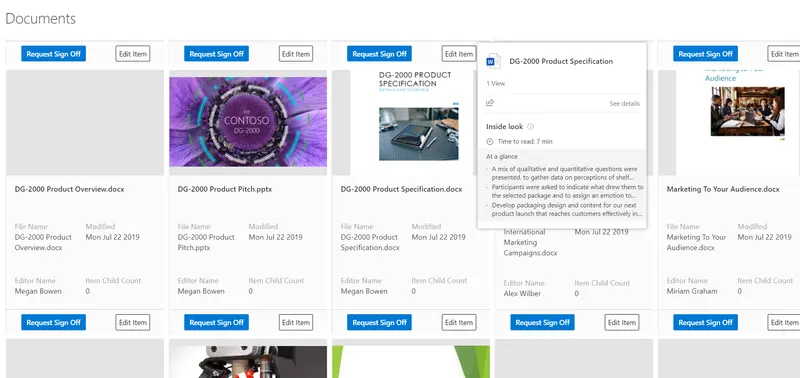
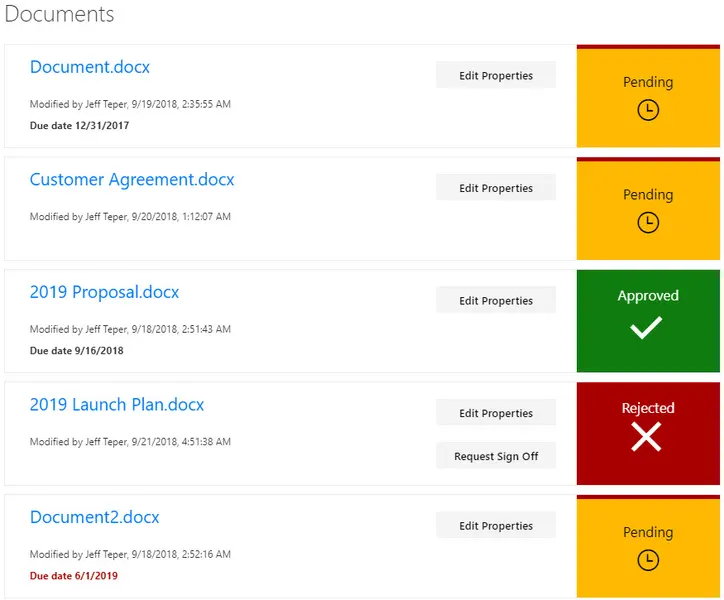
This sample provides a custom view to focus on files within a document library that need to be approved. A Power Automate flow is included to request sign-off (and to launch that flow directly from the view). This format provides a better visual indication of where documents are in the approval process.
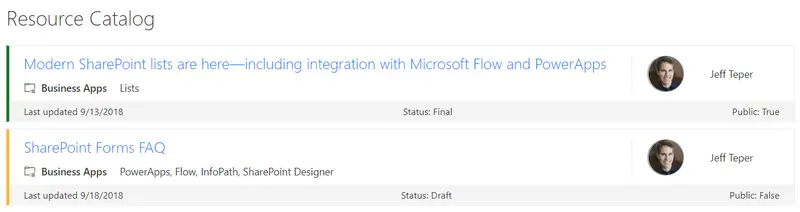
SharePoint lists are excellent places to store information. This example demonstrates how to use a custom SharePoint list to implement a marketing resources catalog. This sample defines a custom view to bring focus to the status of items in the resource catalog. It also provides a better visual experience by displaying all the data in an easy to read format by using icons, colors, and profile pictures.
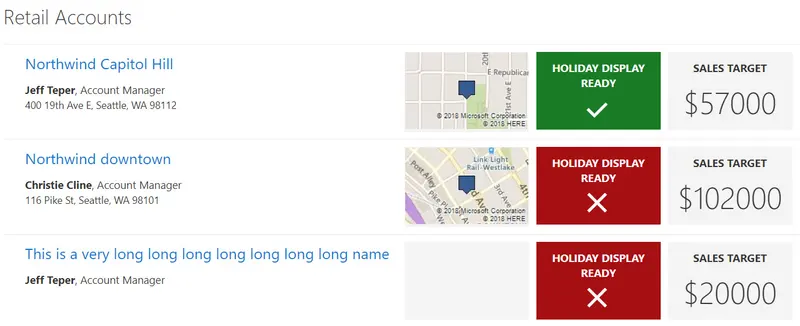
SharePoint lists are excellent places to store information. This example demonstrates how to use a custom SharePoint list to manage retail stores. This sample defines a custom view to bring focus to the status of store locations. It also provides a better visual experience by displaying all the data in an easy to read format by using icons, colors, and Bing maps.
A number column is evaluated against tiers of values to provide colors corresponding to score ranges.
A status column is evaluated to provide colors corresponding to status. This format uses the values Red, Yellow, Green, and Amber but you could easily extend this to fit your own color-coded system by adding or removing nested conditions.
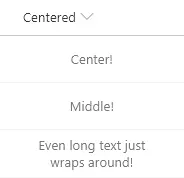
Demonstrates making your content be both vertically and horizontally centered (in the middle) within the cell.
This is a sample of a complex format that customizes the entire display of a row. The goal is to illustrate several key principals including:
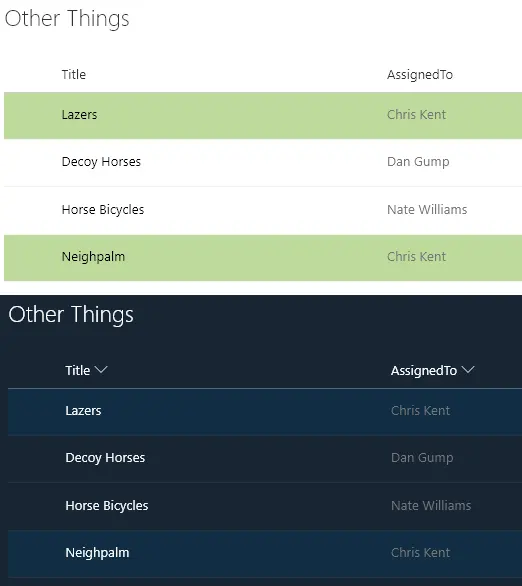
Highlights the entire row for any list items assigned to the current user (the user viewing the list view, not the author of the format). You can easily adjust this to use a different column like Author or Editor by changing the [$AssignedTo] portion of the expression.
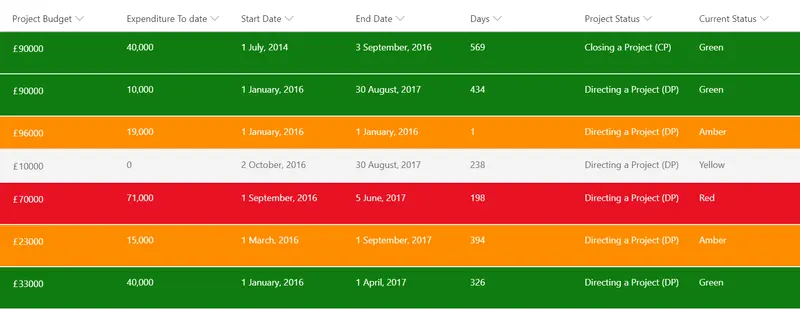
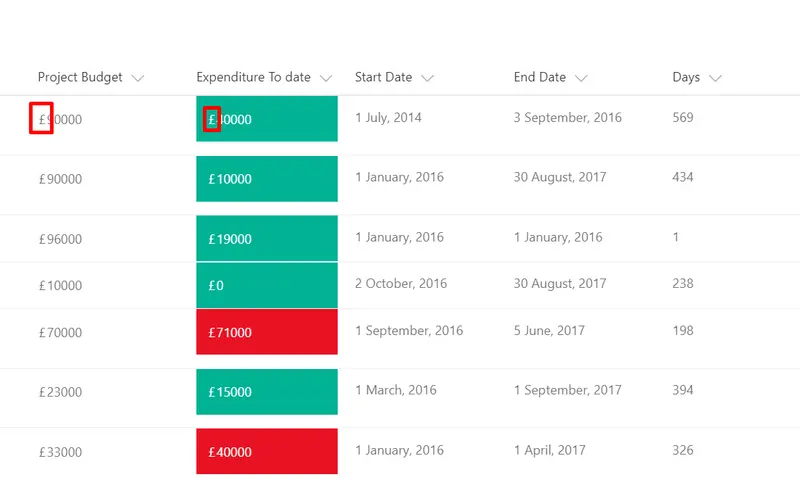
This sample will allow the users to concatenate a currency symbol(£, $ ... etc.) to the existing data. This sample will compare two numeric columns and add a currrency symbol. In this example, two columns (Budget Approved and Expenditure To Date) from a Project Register has been used.
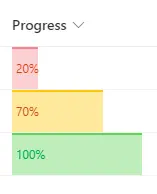
This sample demonstrates displaying progress bar with conditional color based on the value.
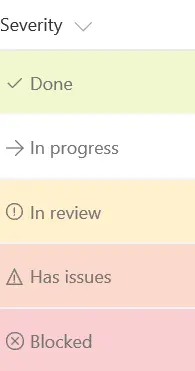
You can apply conditional formatting to text or choice fields that might contain a fixed set of values. This sample applies different classes depending on whether the value of the field is Done, In Review, Blocked, or another value.
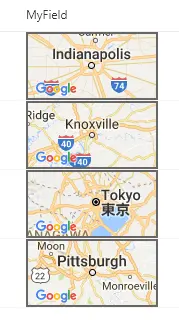
This template takes advantage of Google Maps' staticmap API which generates an image using a parameterized URL.
This sample applies styles to a parent div element and a child img element to show a person's profile picture in a circle.
This sample applies styles to a parent div element and a child img element to show a picture column in a circle.
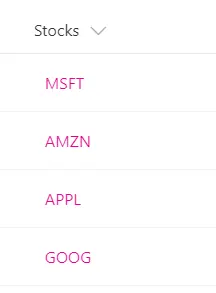
This example shows how to turn a text field that contains stock ticker symbols into a hyperlink that targets the Yahoo Finance real-time quotes page for that stock ticker. The example uses a + operator that appends the current field value to the static hyperlink http://finance.yahoo.com/quote/. You can extend this pattern to any scenario in which you want users to view contextual information related to an item, or you want to start a business process on the current item, as long as the information or process can be accessed via a hyperlink parameterized with values from the list item.
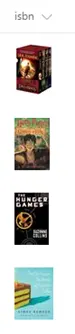
This example retrieves book cover images based on their ISBN numbers by utilizing the Open Library Covers API. The API works by building a cover image URL with the ISBN.
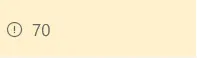
This example uses the conditional operator ? to apply a class (sp-field-severity--warning) to the parent div element when the value in the current field is less than or equal to 70. This causes the field to be highlighted when the value is less than or equal to 70, and appear normally if it's greater than 70.
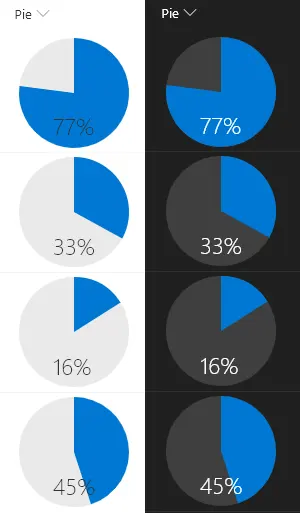
This example renders whole pie in neutralLight with radius 50 and the number% (column value) as a slice of the pie in blue using `<svg>` with `<path>` tags. The number% displayed at the bottom of the pie in neutralPrimary.
Three related formats for use in project management.
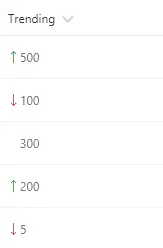
These formats rely on two number fields, Before and After, for which the values can be compared. They show the appropriate trending icon next to the value of the After field, depending on that field's value compared to the value in Before. The sp-field-trending--up class is used when After's value is higher; the sp-field-trending--down class is used when After's value is lower. No icon is shown when they are equal (padding is added to keep consistent alignment).
The Fluent UI icons are easy to use in column formatting by simply specifying the name in the iconName attribute. However, the available selection of icons may not always meet your needs. Fortunately, you can use inline SVG elements with custom paths. This means you can use icons from sources like Font Awesome that provide SVG versions of their icons!
This sample displays a traffic light style (Red-Yellow-Green) status indicator based on the value of a choice/text column (to use a lookup column, switch all occurrences of `@currentField` to `@currentField.lookupValue`).
Using just the Twitter handle, Twitter profile pictures are displayed in a circle and clicking them will open the user's Twitter page in a new window. The handle is also displayed as a tooltip when hovering over the profile image.
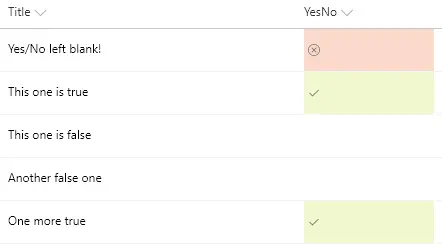
You can apply conditional formatting to Yes/No fields. This sample applies different classes depending on whether the value of the field is Yes (true), No (false), or Blank. This example applies one of the column formatting predefined classes (sp-field-severity--good, sp-field-severity--low, or sp-field-severity--blocked) to the root <div /> based on the field's value. This is what determines the element's background color. A class of `ms-fontColor-neutralSecondary` is always applied to ensure the text color is legible in both light and dark themes. Then, it outputs a <span /> element with an iconName attribute that shows a Fluent UI icon inside that element.
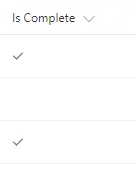
This example displays a check mark when the value of a Yes/No column is equal to Yes. This field uses the iconName attribute to display the CheckMark Fluent UI icon.
This sample uses the @me keyword to check if the person field is the current user and shows that person using a different color and weight. This is a dynamic check that will always highlight the user using the list (not the creater of the format). This template could easily be extended to apply different/additional styles or icons as desired by simply copying the same expression logic for other fields.
You can use column formatting to create buttons that, when clicked, run Flows on the corresponding list item. The Flow Launch Panel will be displayed after clicking the button allowing the user to specify any required data and then run the flow.
You can use column formatting to render quick action links next to fields. This sample, intended for a person field, renders two elements inside the parent `<div />` element:
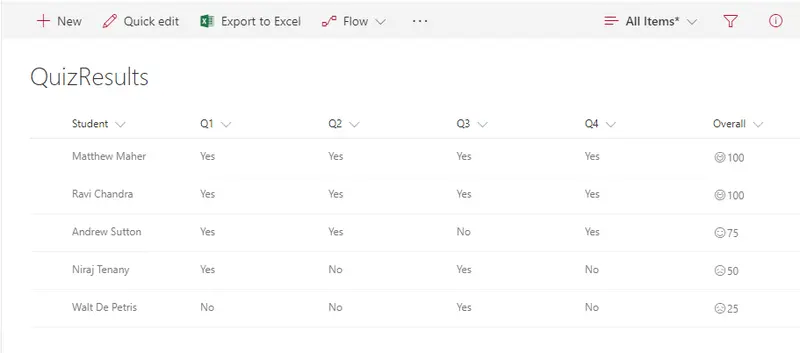
This allows teachers to show smiley faces next to quiz results similar to how they do it on paper. The number (based on a 0-100 score) will indicate if its a smiley or frown, which come from the Offie UI Fabric Icon set. If the number is above 90 the student gets a super smiley (`Emoji`), above 75 regular smile (`Emoji2`), above 60 neutral smiley (`EmojiNeutral`), below 60 a frown (`EmojiDisappointed`), and anything else gets an `Unknown`.
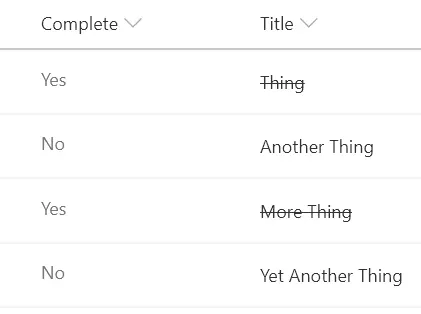
Classic task lists add a strikethrough style to the task name when the task is marked as completed. This sample shows how to achieve this in a modern list view.
This example colors the current field red when the value inside an item's DueDate is before the current date/time. Unlike some of the previous examples, this example applies formatting to one field by looking at the value inside another field. Note that DueDate is referenced using the [$FieldName] syntax. FieldName is assumed to be the internal name of the field. This example also takes advantage of a special value that can be used in date/time fields - `@now`, which resolves to the current date/time, evaluated when the user loads the list view.
This sample demonstrates showing fields on separate rows, conditionally showing a button based on the current user, and how to use the defaultClick rowaction.
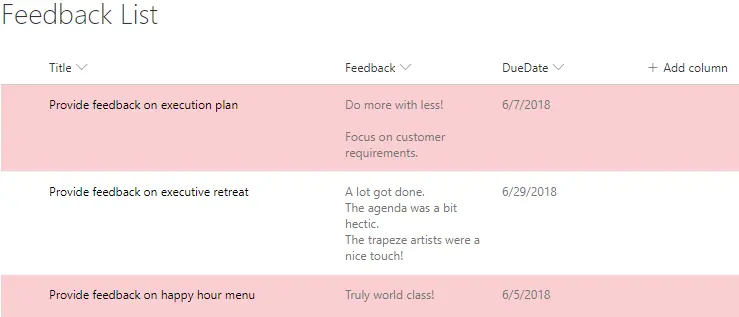
This sample applies a class to any row where the DueDate column is overdue (earlier than @now).
This sample applies a class to the entire row based on the value of a choice field using additionalRowClass to conditionally apply the severity classes.
This sample provides multiple formats to illustrate the options available to link to local resources. The primary purpose is to demonstrate the usage of `@currentWeb` (O365 only) to prevent issues with reusable formats or formats rendered outside of the main list view. This format links to other lists, but this could just as easily be specific pages/files/etc. on a site.
This sample provides multiple formats to illustrate the options available to reference local image files. The primary purpose is to demonstrate the usage of `@currentWeb` (O365 only) to prevent issues with reusable formats or formats rendered outside of the main list view.
Try a broader search or clear a filter.
Built something useful?
A small idea shared can make a big difference. First-time contributors are welcome.