
Back to view formats
View formattingSharePoint Online

Bar Graph

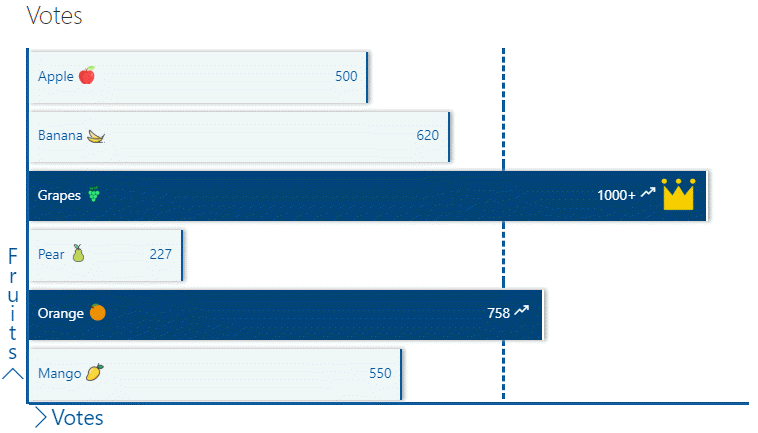
This sample shows how to format a list to show the data as a bar graph.

bargraph
Sample preview · View original image

Copy. Apply. Make it yours.

Get this format

1 definition

Review the requirements below, then paste this JSON into the matching formatting panel. Show me where.

Use your list's internal column names and replace any tenant-specific URLs or flow IDs. Formatting is presentation, not a way to secure data.

View formatting
Download JSON
{
  "$schema": "https://developer.microsoft.com/json-schemas/sp/v2/row-formatting.schema.json",
  "hideSelection": "true",
  "hideColumnHeader": "true",
  "rowFormatter": {
    "elmType": "div",
    "style": {
      "align-items": "flex-end",
      "width": "800px",
      "box-sizing": "border-box",
      "border-left": "3px solid"
    },
    "attributes": {
      "class": "ms-fontColor-themeDark"
    },
    "children": [
      {
        "elmType": "span",
        "txtContent": "Fruits",
        "style": {
          "display": "=if([$IsLastItem], 'block','none')",
          "position": "absolute",
          "left": "-21px",
          "top": "=@rowIndex*70 -130 + 'px'",
          "width": "12px",
          "text-align": "center",
          "font-size": "24px",
          "line-height": "22px"
        }
      },
      {
        "elmType": "span",
        "style": {
          "display": "=if([$IsLastItem], 'block','none')",
          "position": "absolute",
          "left": "-27px",
          "top": "=@rowIndex*70 + 'px'",
          "width": "10px",
          "font-size": "24px"
        },
        "attributes": {
          "iconName": "ChevronUp"
        }
      },
      {
        "elmType": "div",
        "style": {
          "position": "absolute",
          "top": "=@rowIndex*65 + 'px'",
          "left": "=(700 / 1000) * (800 - 45) + 'px'",
          "border-left": "3px dashed",
          "width": "2px",
          "height": "65px"
        },
        "attributes": {
          "class": "animated zoomIn"
        }
      },
      {
        "elmType": "span",
        "style": {
          "display": "=if([$IsLastItem], 'block','none')",
          "position": "absolute",
          "left": "4px",
          "top": "=@rowIndex*70+48 + 'px'",
          "font-size": "24px"
        },
        "attributes": {
          "iconName": "ChevronRight"
        }
      },
      {
        "elmType": "span",
        "txtContent": "Votes",
        "style": {
          "display": "=if([$IsLastItem], 'block','none')",
          "position": "absolute",
          "left": "28px",
          "top": "=@rowIndex*70+48 + 'px'",
          "font-size": "24px",
          "line-height": "24px"
        }
      },
      {
        "elmType": "div",
        "style": {
          "position": "absolute",
          "display": "=if([$IsLastItem], 'block','none')",
          "left": "px",
          "top": "=@rowIndex*70+42 + 'px'",
          "border-bottom": "3px solid",
          "width": "800px",
          "height": "2px"
        }
      },
      {
        "elmType": "div",
        "attributes": {
          "class": "=if([$Votes] >= 700, 'ms-bgColor-themeDarker ms-fontColor-white ms-bgColor-themePrimary--hover ms-fontColor-white--hover ms-font-m animated bounceInLeft delay-1s', 'ms-bgColor-themeLighterAlt ms-bgColor-themePrimary--hover ms-fontColor-white--hover ms-font-m animated bounceInLeft delay-1s')",
          "title": "=[$Title] + ' has ' + [$Votes] + ' Votes' + if([$Votes] >= 700, ' and is trending.','.')"
        },
        "style": {
          "height": "56px",
          "width": "=if([$Votes] >= 1000, (800 - 45) + 'px', ([$Votes] / 1000) * (800 - 45) + 'px')",
          "margin": "5px 0px",
          "box-shadow": "2px 0px 4px 0px darkgrey",
          "box-sizing": "border-box",
          "padding": "15px 10px",
          "border-right": "2px solid",
          "z-index": "1"
        },
        "children": [
          {
            "elmType": "div",
            "style": {
              "margin-top": "-12px",
              "margin-bottom": "10px",
              "display": "=if([$IsHighest], 'block','none')",
              "color": "#FFD700",
              "font-size": "42px",
              "float": "right"
            },
            "attributes": {
              "iconName": "CrownSolid"
            }
          },
          {
            "elmType": "div",
            "style": {
              "display": "=if([$Votes] >= 700, 'block','none')",
              "float": "right",
              "margin-left": "5px",
              "margin-right": "5px"
            },
            "attributes": {
              "iconName": "Trending12"
            }
          },
          {
            "elmType": "span",
            "txtContent": "=if([$Votes] > 1000, '1000+', [$Votes])",
            "style": {
              "display": "block",
              "float": "right"
            }
          },
          {
            "elmType": "span",
            "txtContent": "[$Title]",
            "style": {
              "display": "block",
              "float": "left"
            }
          },
          {
            "elmType": "img",
            "attributes": {
              "src": "[$Icon]"
            },
            "style": {
              "display": "block",
              "float": "left",
              "width": "20px",
              "margin-left": "5px"
            }
          }
        ]
      }
    ]
  }
}
Schema compatibility review notes

This historical definition differs from the pinned Microsoft schema. This may indicate an unsupported pattern or a schema limitation. Check the original requirements and test in your tenant before use.

  • /hideSelection must be boolean

From the contributor

How to use this sample

Summary

This sample shows how to format a list to show the data as a bar graph. In this instance we are showing number of votes per fruit.
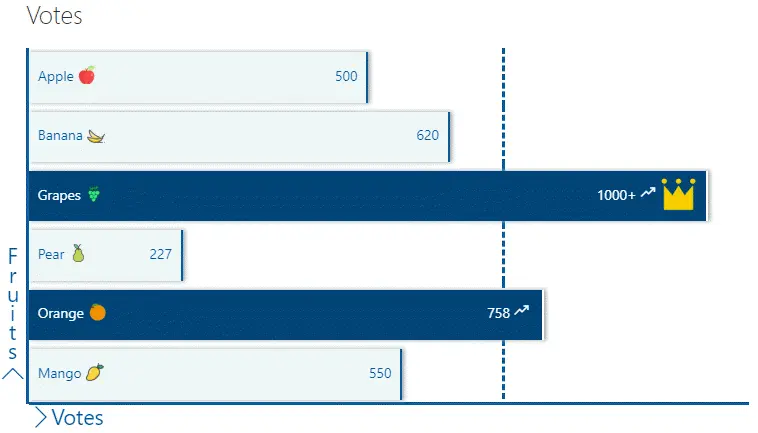
screenshot of the sample

The sample features the following:

  • Conditionally showing a crown icon if the item is marked as MostVoted
  • Conditionally showing elements (trending limit) based on @rowIndex
  • Conditionally showing a trending icon if the item has more than 700 votes
  • Conditionally changing the colour of the bar if the item has more than 700 votes
  • Use of theme color classes to ensure the format displays as intended regardless of theme (light, dark, custom, etc.)
  • If inject css application customiser with animate.css is deployed then, this sample adds animation to bars.

View with animate.css application customiser

Bar Graph Screenshot with animate.css app customiser

View requirements

Type Internal Name Required
Single line of text Title Yes
Number Votes
Yes/No IsLastItem
Yes/No IsHighest
Single line of text Icon

Setup

The sample needs the following setup:

  • Only one item needs to have IsHighest as yes
  • Only the last item needs to have IsLastItem as yes

The idea is that this data gets populated via some code so that it can represented as a graph.

In the sample, the height of the parent div is set to 800px and the child div calculates heights. The heights are calcuated considering 1000 as the max number of votes. If this number needs changed, please update the formulas in lines 50 and 103 accordingly.

Inject CSS applcation customiser

The inject css application customiser by Hugo Bernier shows how we can inject css on to pages. Please follow the instructions in readme.md of that sample and use animate.min.css instead of custom.css .

Sample

Solution Author(s)
bar-graph.json Anoop Tatti

Version history

Version Date Comments
1.0 September 02, 2019 Initial release

Improvements

Need to check if a gradient css can also be added to the bars, with an application customiser.

Disclaimer

THIS CODE IS PROVIDED AS IS WITHOUT WARRANTY OF ANY KIND, EITHER EXPRESS OR IMPLIED, INCLUDING ANY IMPLIED WARRANTIES OF FITNESS FOR A PARTICULAR PURPOSE, MERCHANTABILITY, OR NON-INFRINGEMENT.