
From the contributor
How to use this sample
Summary
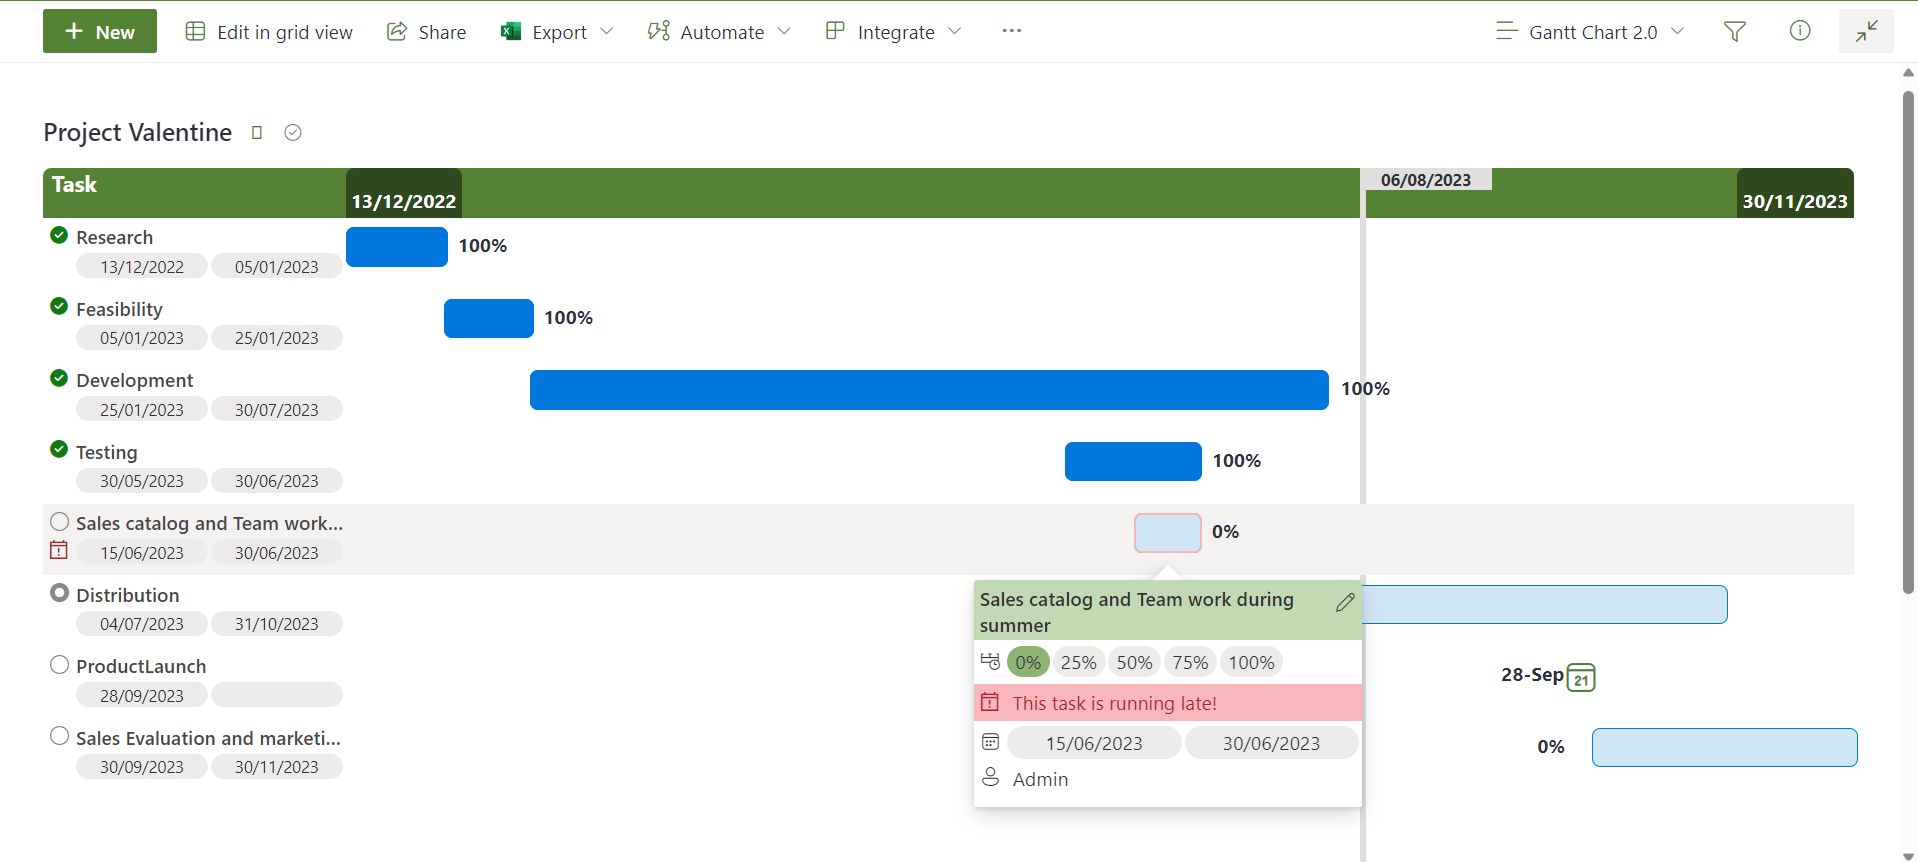
This project Gantt Chart sample demonstrates how to show a list of high level tasks in a Gantt chart. It is mainly useful for top-level views.
So this
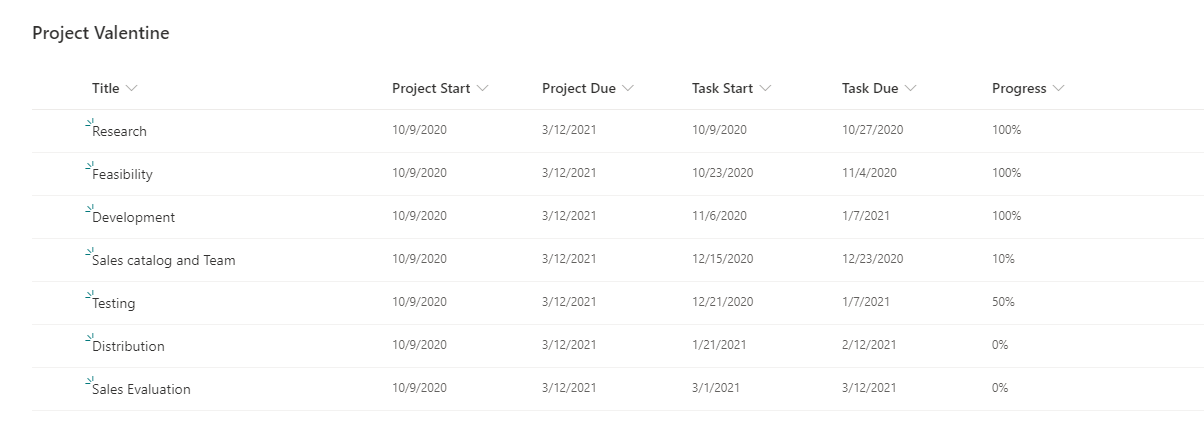
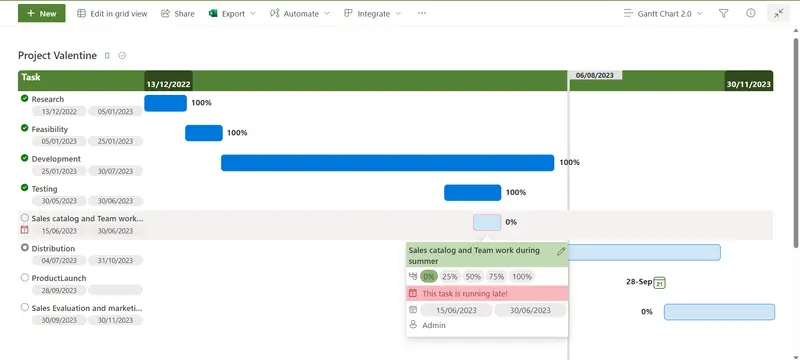
Turns into this
View requirements
This format expects the following columns to be part of the view:
| Type | Internal Name | Required | Values\ |
|---|---|---|---|
| Single line of text | Title | Yes | |
| Date | ProjectStart | Yes | |
| Date | ProjectDue | Yes | |
| Date | TaskStart | Yes | |
| Date | TaskDue | Yes | |
| Number | Progress | Yes | |
| Choice | TaskType | No | Task, Milestone |
| People (single select) | AssignedToUser | Yes | |
| Multilines of text (no format) | TaskDescription | Yes |
The view should be sorted by TaskStart, ascending
Sample
| Solution | Author(s) |
|---|---|
| project-gantt-chart.json | Geert de Kooter |
Version history
| Version | Date | Comments |
|---|---|---|
| 1.0 | November 1, 2020 | Initial release |
| 2.0 | February 10, 2021 | Added status Progress indicator, current date indicator, and width fixes |
| 3.0 | August 12, 2023 | Added Milestones, Progressbar, Clicks to update the progress, Task description, Task assignment, Labels that mover from right to left based on the amount of space. |
Disclaimer
THIS CODE IS PROVIDED AS IS WITHOUT WARRANTY OF ANY KIND, EITHER EXPRESS OR IMPLIED, INCLUDING ANY IMPLIED WARRANTIES OF FITNESS FOR A PARTICULAR PURPOSE, MERCHANTABILITY, OR NON-INFRINGEMENT.
Additional notes
None