
Back to view formats
View formattingSharePoint Online

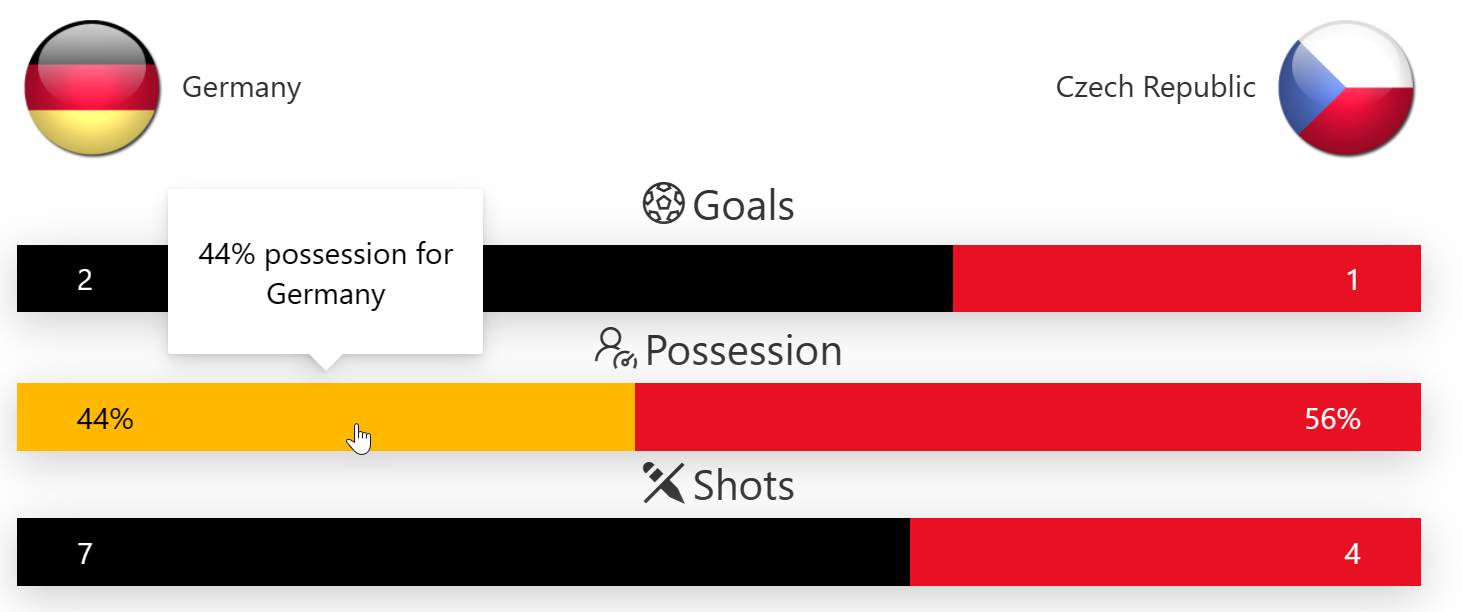
Stat Comparison Chart

Format a list view into a chart that shows a comparison between two entities against various attributes

Stat Comparison Chart formatting preview
Sample preview · View original image

Copy. Apply. Make it yours.

Get this format

2 definitions

Review the requirements below, then paste this JSON into the matching formatting panel. Show me where.

Use your list's internal column names and replace any tenant-specific URLs or flow IDs. Formatting is presentation, not a way to secure data.

View formatting
Download JSON
{
  "$schema": "https://developer.microsoft.com/json-schemas/sp/v2/row-formatting.schema.json",
  "hideColumnHeader": true,
  "hideSelection": true,
  "rowFormatter": {
    "elmType": "div",
    "style": {
      "width": "90%",
      "height": "90px",
      "display": "flex",
      "flex-direction": "column",
      "margin-left": "40px",
      "margin-right": "40px"
    },
    "children": [
      {
        "elmType": "div",
        "txtContent": "[$Title]",
        "style": {
          "width": "100%",
          "height": "100%",
          "display": "flex",
          "align-items": "center",
          "justify-content": "center",
          "padding": "5px"
        },
        "attributes": {
          "class": "ms-fontSize-28"
        }
      },
      {
        "elmType": "div",
        "style": {
          "width": "100%",
          "display": "flex",
          "flex-direction": "row",
          "box-shadow": "0px 7px 29px 0px #ccc"
        },
        "children": [
          {
            "elmType": "div",
            "style": {
              "width": "= (([$Entity1] * 100) / ([$Entity1] + [$Entity2])) + '%'",
              "height": "45px",
              "cursor": "pointer",
              "display": "flex",
              "flex-direction": "row",
              "align-items": "center",
              "justify-content": "center"
            },
            "txtContent": "=([$Entity1] + if([$IsPercent], '%', ''))",
            "attributes": {
              "class": "ms-fontSize-20 ms-bgColor-blue ms-bgColor-blueDark--hover ms-fontColor-white"
            },
            "customCardProps": {
              "directionalHint": "bottomCenter",
              "isBeakVisible": true,
              "openOnEvent": "hover",
              "formatter": {
                "elmType": "div",
                "style": {
                  "width": "200px",
                  "height": "100px",
                  "display": "flex",
                  "flex-direction": "column",
                  "align-items": "center",
                  "justify-content": "center",
                  "padding": "5px"
                },
                "children": [
                  {
                    "elmType": "div",
                    "style": {
                      "text-align": "center"
                    },
                    "txtContent": {
                      "operator": "+",
                      "operands": [
                        "=([$Entity1] + if([$IsPercent], '%', ''))",
                        " ",
                        "=toLowerCase([$Title])",
                        " for ",
                        "[!Entity1.DisplayName]"
                      ]
                    },
                    "attributes": {
                      "class": "ms-fontSize-20 ms-fontColor-blue"
                    }
                  }
                ]
              }
            }
          },
          {
            "elmType": "div",
            "style": {
              "width": "= (([$Entity2] * 100) / ([$Entity1] + [$Entity2])) + '%'",
              "height": "45px",
              "cursor": "pointer",
              "display": "flex",
              "flex-direction": "row",
              "align-items": "center",
              "justify-content": "center"
            },
            "txtContent": "=([$Entity2] + if([$IsPercent], '%', ''))",
            "attributes": {
              "class": "ms-fontSize-20 ms-bgColor-red ms-bgColor-redDark--hover ms-fontColor-white"
            },
            "customCardProps": {
              "directionalHint": "bottomCenter",
              "isBeakVisible": true,
              "openOnEvent": "hover",
              "formatter": {
                "elmType": "div",
                "style": {
                  "width": "200px",
                  "height": "100px",
                  "display": "flex",
                  "flex-direction": "column",
                  "align-items": "center",
                  "justify-content": "center",
                  "padding": "5px"
                },
                "children": [
                  {
                    "elmType": "div",
                    "style": {
                      "text-align": "center"
                    },
                    "txtContent": {
                      "operator": "+",
                      "operands": [
                        "=([$Entity2] + if([$IsPercent], '%', ''))",
                        " ",
                        "=toLowerCase([$Title])",
                        " for ",
                        "[!Entity2.DisplayName]"
                      ]
                    },
                    "attributes": {
                      "class": "ms-fontSize-20 ms-fontColor-red"
                    }
                  }
                ]
              }
            }
          }
        ]
      }
    ]
  }
}

From the contributor

How to use this sample

Summary

These samples format a list view into a chart that shows a comparison between two entities against various attributes. This sample can be used for all sorts of things but is demonstrated below using sports teams for the entities and stats for the teams as individual rows.
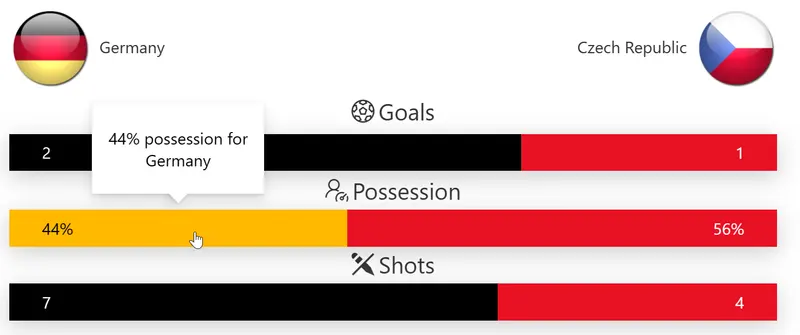
screenshot of the sample

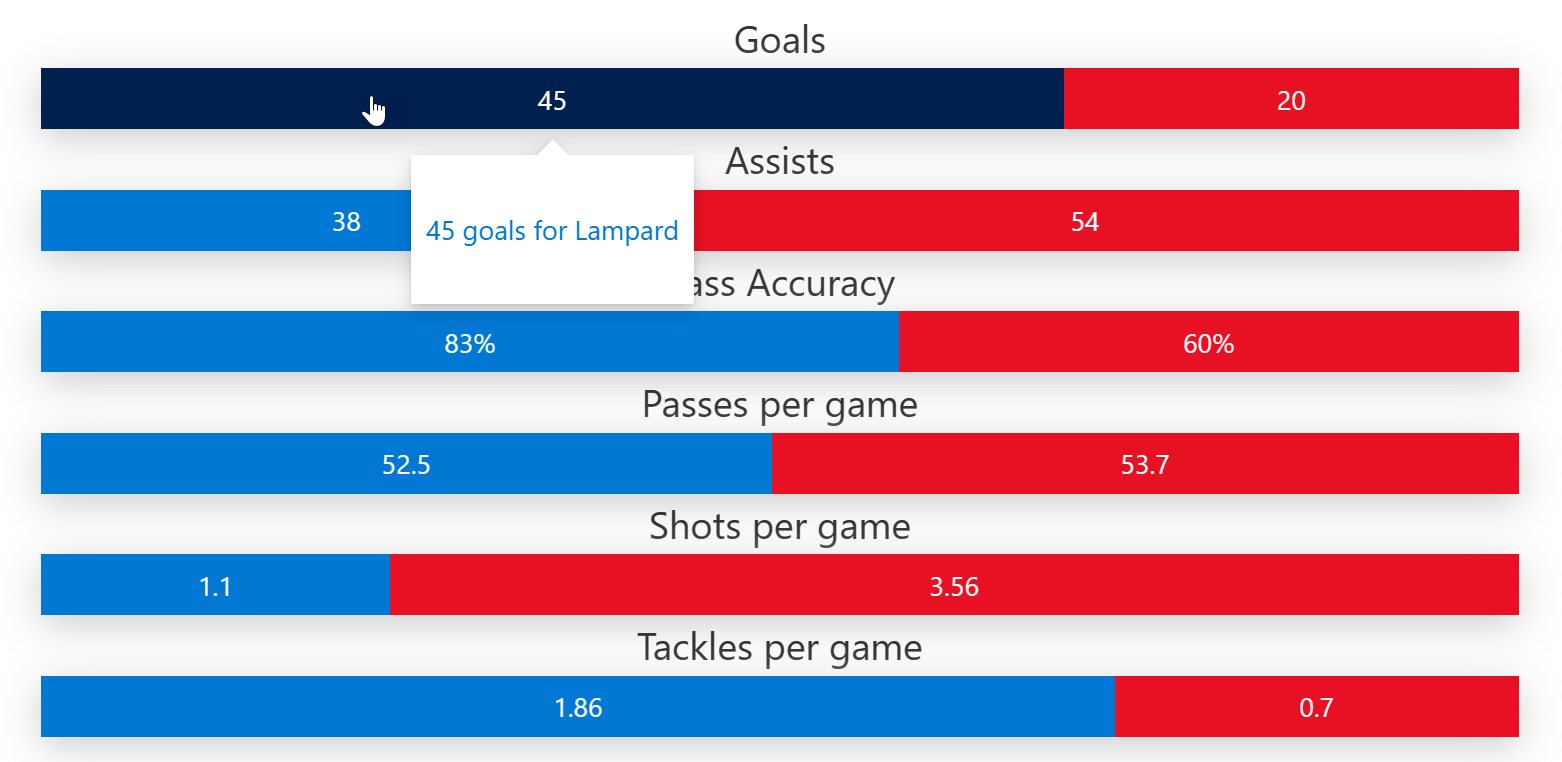
There are 2 versions of the sample included. The difference being that one shows images to represent each entity (team country flags in this case) and icons for individual stats while the other does not.

Version without Images: screenshot of the sample without images
These samples are dervied from the Butterfly Chart Sample.

View requirements (stat-comparison-chart.json)

Type Internal Name Required Details
Single line of text Title Yes The attribute against which the stats are measured
Single line of text Icon No Icon to represent the attribute
Number Entity1 Yes The stat value for the first entity
Number Entity2 Yes The stat value for the second entity
Yes/No IsPercent No True when the stat is a percentage
Image Entity1Image No Image to represent the first entity. Will be only displayed for the first row at the top left.
Image Entity2Image No Image to represent the second entity. Will be only displayed for the first row at the top right.

View requirements (stat-comparison-chart-without-images.json)

These requirements are the same as above except that icons and images are not needed.

Type Internal Name Required
Single line of text Title Yes
Number Entity1 Yes
Number Entity2 Yes
Yes/No IsPercent No

Sample

Solution Author(s)
stat-comparison-chart.json Anoop Tatti
stat-comparison-chart-without-images.json Anoop Tatti

Version history

Version Date Comments
1.0 June 23, 2021 Initial release

Disclaimer

THIS CODE IS PROVIDED AS IS WITHOUT WARRANTY OF ANY KIND, EITHER EXPRESS OR IMPLIED, INCLUDING ANY IMPLIED WARRANTIES OF FITNESS FOR A PARTICULAR PURPOSE, MERCHANTABILITY, OR NON-INFRINGEMENT.