
From the contributor
How to use this sample
Summary
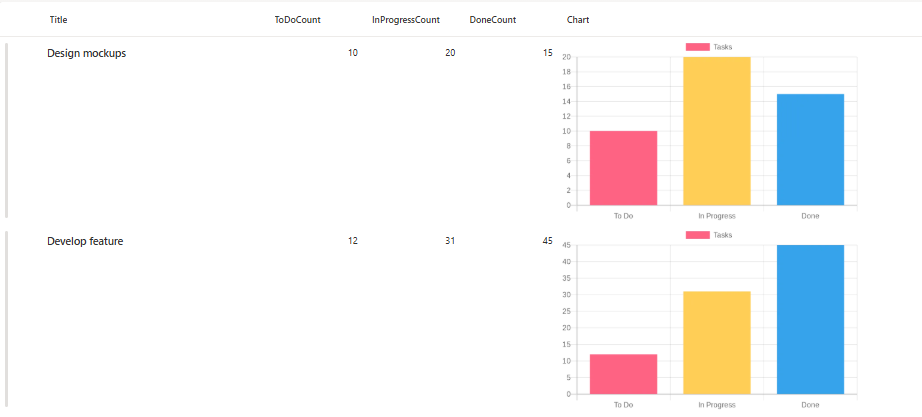
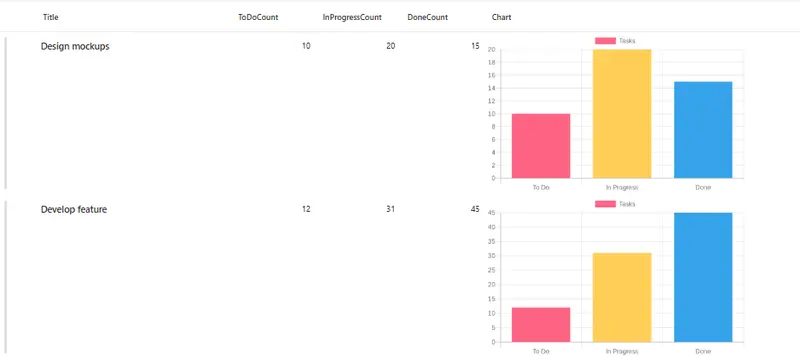
This sample uses SharePoint List Formatting to automatically generate a bar chart visualization for task status counts in each list item.
Each row displays a dynamically generated bar chart showing the distribution of tasks across three states: "To Do", "In Progress", and "Done", making it easy to visualize project or task progress at a glance.
View Requirements
Create a list with the following columns:
| Internal Name | Type |
|---|---|
| Title | Single line of text |
| ToDoCount | Number |
| InProgressCount | Number |
| DoneCount | Number |
| Charts | Single line of text |
Note: Additional columns can be added as needed for your specific use case.
Sample Data
| ToDoCount | InProgressCount | DoneCount |
|---|---|---|
| 5 | 3 | 12 |
| 8 | 2 | 5 |
| 0 | 4 | 16 |
How it Works
- The formatter displays a bar chart for each list item based on task status counts
- Charts are generated dynamically using the QuickChart.io API
- Each bar chart visualizes three data segments with unique colors:
- To Do (Red - #FF6384)
- In Progress (Yellow - #FFCE56)
- Done (Blue - #36A2EB)
- The layout displays charts at 400x250 pixels with rounded corners
- The chart automatically updates when column values change
Security Configuration
CRITICAL: Before the charts will display, you must configure SharePoint security settings:
- Navigate to SharePoint Admin Center
- Go to Settings > Advanced Settings
- Find "HTML Field Security" section
- Add
quickchart.ioto the allowed domains list - Save the configuration
Without this security configuration, charts will not display due to SharePoint's content security policies.
Sample
| Solution | Author(s) |
|---|---|
| generic-quick-charts-bar-chart.json | Sai Bandaru |
Version history
| Version | Date | Comments |
|---|---|---|
| 1.0 | October 08, 2025 | Initial release |
Disclaimer
THIS CODE IS PROVIDED AS IS WITHOUT WARRANTY OF ANY KIND, EITHER EXPRESS OR IMPLIED, INCLUDING ANY IMPLIED WARRANTIES OF FITNESS FOR A PARTICULAR PURPOSE, MERCHANTABILITY, OR NON-INFRINGEMENT.
Change Bar Colors: Modify the backgroundColor hex codes in the URL:
- Current:
%23FF6384(Red),%23FFCE56(Yellow),%2336A2EB(Blue) - Replace with your preferred colors (remember to URL-encode the # symbol as %23)
Adjust Chart Size: Modify the dimensions in the style section:
"style": {
  "width": "500px",
  "height": "300px"
}
Change Chart Labels:
The labels are URL-encoded in the chart URL. To customize labels, modify the labels array in the decoded URL:
- Current:
["To Do","In Progress","Done"] - Modify as needed for your use case
Customize Dataset Label:
Change label:%22Tasks%22 to any text you prefer (URL-encode the text)
Border Radius:
Adjust the border-radius value to change corner roundness (use "0px" for square corners)
Use Cases
- Project Management: Visualize task completion status across multiple projects
- Sprint Tracking: Monitor work items in agile development workflows
- Resource Allocation: Display distribution of team members across different work states
- Quality Assurance: Track bug status distribution (open, in progress, resolved)
- Sales Pipeline: Visualize deals across different pipeline stages
- Support Tickets: Monitor ticket distribution by status
- Inventory Management: Track stock levels across different categories
Chart URL Structure
The QuickChart URL uses the Chart.js configuration format (URL-encoded):
https://quickchart.io/chart?c={
  type: "bar",
  data: {
    labels: ["To Do","In Progress","Done"],
    datasets: [{
      label: "Tasks",
      data: [5,3,12],
      backgroundColor: ["#FF6384","#FFCE56","#36A2EB"]
    }]
  }
}
Color Palette
The default color scheme uses:
- Red (#FF6384): Represents "To Do" tasks - typically indicating pending work
- Yellow (#FFCE56): Represents "In Progress" tasks - showing active work
- Blue (#36A2EB): Represents "Done" tasks - completed work
You can customize these colors to match your organization's branding or create different visual meanings.
Limitations
- Requires internet connectivity for chart generation
- External dependency on QuickChart.io API
- Performance may vary with large lists due to multiple API calls
- Limited customization without modifying the URL-encoded chart configuration
- Chart renders as a static image (not interactive)
Advanced Customization
For more advanced chart customization (colors, legends, etc.), you can modify the Chart.js configuration in the URL. Refer to the QuickChart.io documentation for available options.
License
This formatting solution is provided as-is for educational and professional use. The QuickChart.io API has its own terms of service.