
From the contributor
How to use this sample
Summary
This collection provides three different chart visualizations for task status data in SharePoint lists using column formatting. Each formatter automatically generates dynamic charts showing the distribution of tasks across "To Do", "In Progress", and "Done" states.
Available Chart Types
This sample includes three chart variations:
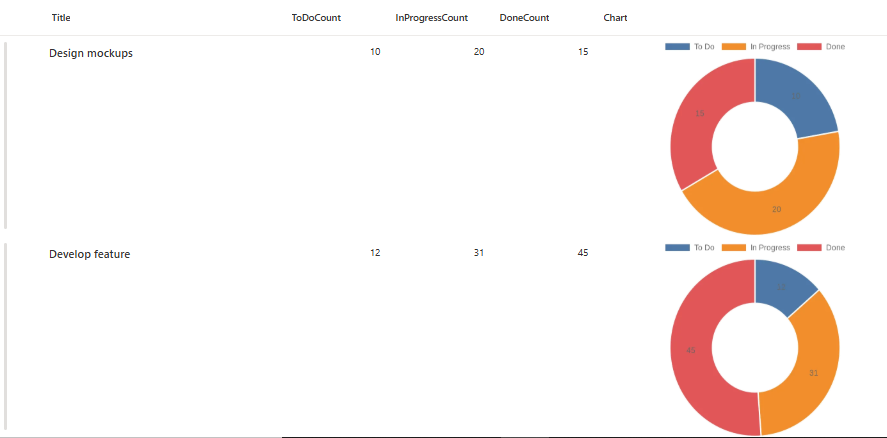
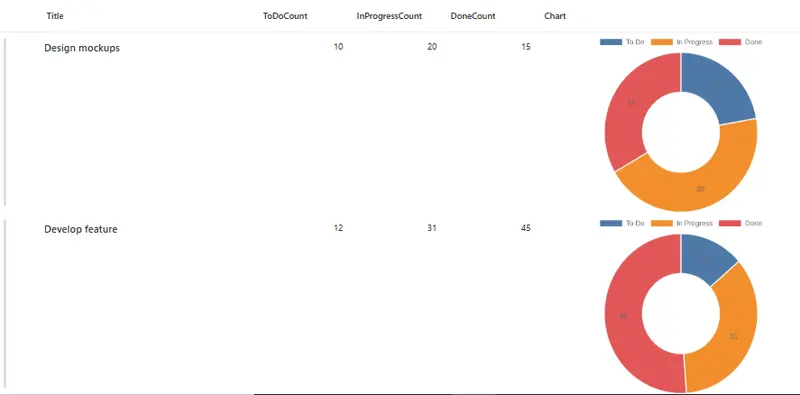
- doughnut Chart (
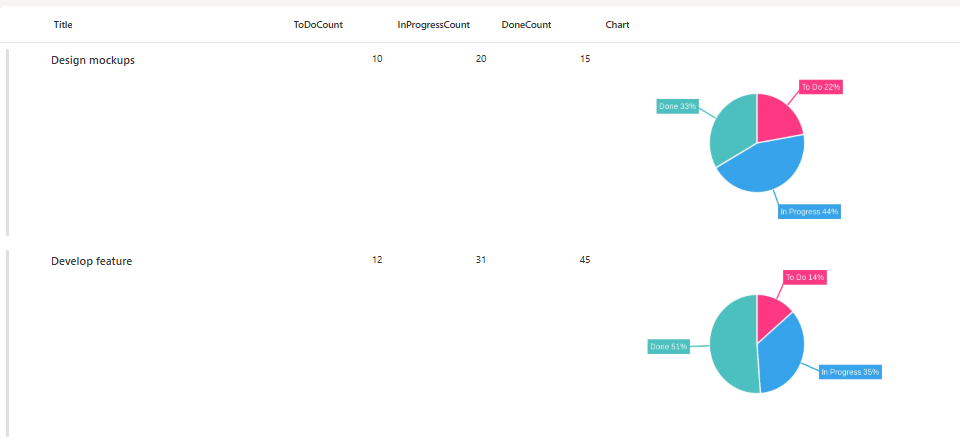
generic-quick-charts-io.json) - Classic doughnut with automatic colors - Outlabeled Pie Chart (
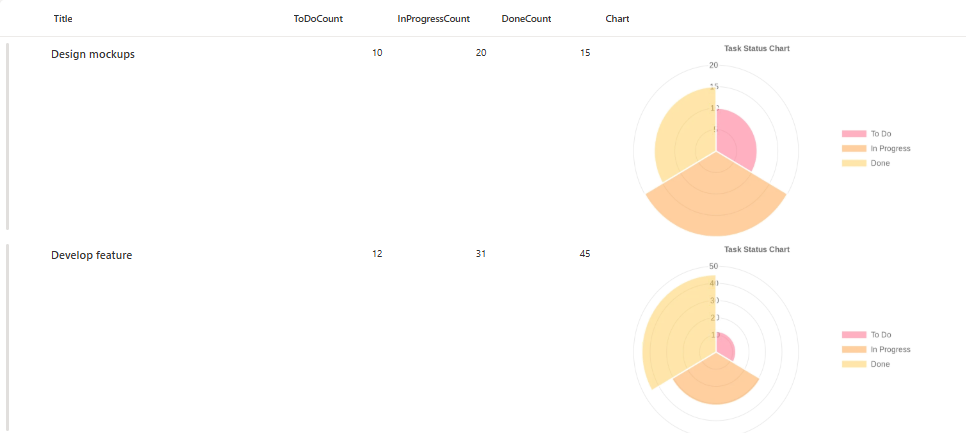
generic-quick-charts-outlabeledPie.json) - Enhanced pie chart with labels outside segments - Polar Area Chart (
generic-quick-charts-polararea.json) - Polar area chart with legend and title
View Requirements
Create a list with the following columns:
| Internal Name | Type |
|---|---|
| Title | Single line of text |
| ToDoCount | Number |
| InProgressCount | Number |
| DoneCount | Number |
| Charts | Single line of text |
Note: Additional columns can be added as needed for your specific use case.
Sample Data
| ToDoCount | InProgressCount | DoneCount |
|---|---|---|
| 5 | 3 | 12 |
| 8 | 2 | 5 |
| 0 | 4 | 16 |
Chart Variations
1. Doughnut Chart
- Clean, simple doughnut chart visualization
- Automatic color assignment by QuickChart.io
- Ideal for basic status visualization
- File:
generic-quick-charts-doughnut.json
2. Outlabeled Pie Chart
- Labels positioned outside pie segments
- Custom colors: Red (#FF3784), Blue (#36A2EB), Teal (#4BC0C0)
- Displays label name and percentage ("%l %p")
- Responsive font sizing (12-18px)
- File:
generic-quick-charts-pie-outlabeled.json
3. Polar Area Chart
- Polar area visualization with semi-transparent segments
- Right-positioned legend
- Chart title: "Task Status Chart"
- Custom RGBA colors with 50% opacity
- File:
generic-quick-charts-polararea.json
How it Works
- The formatter displays a doughnut chart for each list item based on task status counts
- Charts are generated dynamically using the QuickChart.io API
- Each doughnut chart visualizes three data segments:
- To Do (first segment)
- In Progress (second segment)
- Done (third segment)
- The layout displays charts at 400x250 pixels with rounded corners
- The chart automatically updates when column values change
Security Configuration
CRITICAL: Before the charts will display, you must configure SharePoint security settings:
- Navigate to SharePoint Site
- Go to Site Settings
- Find "HTML Field Security" section
- Add
quickchart.ioto the allowed domains list - Save the configuration
Without this security configuration, charts will not display due to SharePoint's content security policies.
Sample
| Solution | Author(s) |
|---|---|
| generic-quick-charts-io.json | Sai Bandaru |
| generic-quick-charts-outlabeledPie.json | Sai Bandaru |
| generic-quick-charts-polararea.json | Sai Bandaru |
Version history
| Version | Date | Comments |
|---|---|---|
| 1.0 | October 13, 2025 | Initial release |
Disclaimer
THIS CODE IS PROVIDED AS IS WITHOUT WARRANTY OF ANY KIND, EITHER EXPRESS OR IMPLIED, INCLUDING ANY IMPLIED WARRANTIES OF FITNESS FOR A PARTICULAR PURPOSE, MERCHANTABILITY, OR NON-INFRINGEMENT.
Limitations
- Requires internet connectivity for chart generation
- External dependency on QuickChart.io API availability
- Performance may vary with large lists due to multiple API calls
- Maximum URL length restrictions may apply for complex configurations
- Charts may take a moment to render on initial page load
Advanced Customization
You can customize the charts by modifying the URL-encoded Chart.js configuration:
- Colors: Modify
backgroundColorarrays with hex or rgba values - Labels: Change text in the
labelsarray - Legend Position: Adjust
legend.position(top, bottom, left, right) - Chart Size: Modify the
widthandheightin thestylesection - Fonts: Customize font sizes and families in chart options
- Animations: Add animation configurations to the options object
Refer to the QuickChart.io documentation and Chart.js documentation for all available customization options.
Troubleshooting
Charts not displaying:
- Verify
quickchart.iois added to HTML Field Security settings - Check that column internal names match exactly (case-sensitive)
- Ensure numeric columns contain valid numbers (not text)
- Clear browser cache and refresh the page
Charts showing incorrect data:
- Verify the column internal names in your JSON match your list columns
- Check that you're applying the formatter to the correct column
- Ensure numeric values are not null or empty
Performance Tips
- For large lists (500+ items), consider using view filters to limit rendered items
- Use indexed columns for better filtering performance
- Consider caching strategies for frequently accessed lists
- Monitor QuickChart.io API usage and rate limits
License
This formatting solution is provided as-is for educational and professional use. The QuickChart.io API has its own terms of service and usage limits. Please review their documentation for production use.