
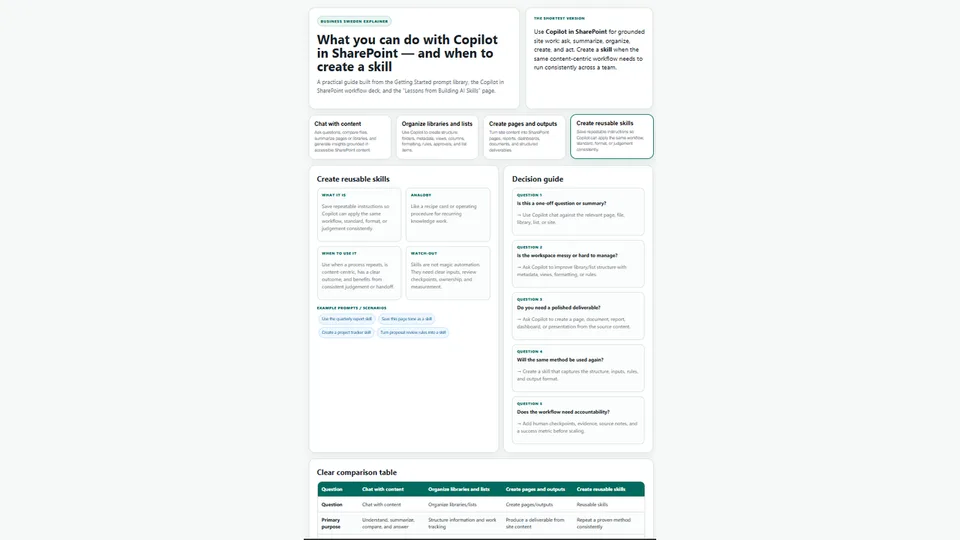
Generates a fully self-contained, interactive HTML dashboard for explaining business, technical, or strategic topics.
Uses an adaptive layout with hero section, core concept cards, active detail panel, comparison tables, optional decision guides, use cases, governance notes, and source attribution.
Outputs clean, professional content that is scannable, actionable, and ready to save directly in SharePoint or share as a single .html file.
Ideal for knowledge sharing, onboarding, strategy communication, training materials, and executive briefings.
Creates a polished, interactive explainer dashboard for any business, technical, or strategic topic. Uses a clean professional card-based structure featuring concept cards, comparisons, decision guides, use cases, governance notes, and source attribution. Outputs a fully self-contained HTML dashboard ready for SharePoint pages, sharing, or embedding.
What you get
- A modern, card-based interactive HTML dashboard tailored to the requested topic
- Professional tone with clear analogies, plain-language definitions, practical examples, and watch-outs
- Adaptive layout that only includes the most relevant sections for the topic (hero + shortest version, core concept cards, active detail panel, comparison tables, decision guides, use cases, governance notes, source notes)
- Fully standalone HTML/CSS/JavaScript — no external dependencies or build step required
- Searchable/filterable use cases (when applicable)
- Easy to save as a
.htmlfile directly in SharePoint or share as a single file - Consistent, high-quality structure that works across topics while staying focused and scannable
SharePoint Skill
| Solution | Author(s) |
|---|---|
| topic-explainer | Anand Ragavan | GitHub | LinkedIn |
Version history
| Version | Date | Comments |
|---|---|---|
| 1.0 | July 2026 | Initial Release |
Disclaimer
THIS CODE IS PROVIDED AS IS WITHOUT WARRANTY OF ANY KIND, EITHER EXPRESS OR IMPLIED, INCLUDING ANY IMPLIED WARRANTIES OF FITNESS FOR A PARTICULAR PURPOSE, MERCHANTABILITY, OR NON-INFRINGEMENT.
Package
Ready to install
The ZIP contains only the upload-ready inner skill folder.
View SKILL.md
---
name: topic-explainer
description: |-
  Create an adaptive interactive explainer dashboard for a user-specified topic, using a clean professional card-based structure with concept cards, comparisons, topic-fit sections, optional decision guides, use cases, governance notes, and source notes.

  Use when the user says:
    - "create an explainer of a topic"
    - "create an explainer dashboard for <topic>"
    - "make an explainer about <topic>"
    - "turn this topic into an explainer"
    - "build a dashboard that explains <topic>"
    - "create a topic explainer"
---
# Topic Explainer

## When to use
Use this skill whenever the user asks to create an explainer, explainer page, or explainer dashboard for a topic. The output should be a polished, interactive HTML dashboard that explains the topic clearly for a business audience.

Use a clean, professional card-based design as the content model, but adapt the sections to fit the topic and content. Do not force every section into every dashboard.

## Inputs
- Required: the topic to explain.
- Optional: target audience, organization/team context, preferred tone, source files/pages, and whether the dashboard should be saved as a SharePoint file or shown inline.
- If the topic needs current, enterprise, or document-specific information, retrieve or summarize the relevant content first. Do not invent source-specific claims.

## Steps
1. Identify the explainer topic, audience, and main user need from the request.
2. Decide which sections fit the topic before building the dashboard. Use the strongest-fit sections only:
   - Always consider: hero/header, shortest version, core concept cards, active-detail panel, comparison table, use cases/examples, governance or watch-outs, and source notes.
   - Include a **decision guide** only when the topic asks users to choose between options, make a recommendation, follow a path, or decide “when to use what”.
   - Include a **Without vs With** section only when the topic naturally compares adopting a capability, method, or maturity step. Skip it for side-by-side product comparisons where it feels artificial.
   - Include a **context overload / complexity explanation** only when reusable instructions, knowledge context, complexity, or prompt burden is central to the topic.
   - Include implementation, rollout, adoption, governance, or operating model sections only when relevant.
3. If a section is skipped, rebalance the layout. Do not leave an empty adjacent panel. Expand the neighboring section to full width, replace the skipped section with a better-fit section, or use a single-column layout for that row.
4. Build the dashboard content around the selected sections. Common section options:
   - Hero/header with a short title, subtitle, and “shortest version”.
   - 3–5 core concept cards for the most important ideas in the topic.
   - Active concept detail panel containing: what it is, analogy, when to use it, example prompts/scenarios, and watch-outs.
   - Decision guide with practical questions and recommendations, when relevant.
   - Clear comparison table across the core concepts, platforms, methods, or options.
   - “Without vs with” section, only when it creates real explanatory value.
   - Topic-specific section such as channel selection, operating principles, adoption playbook, risks, anti-patterns, stakeholder map, maturity model, or examples.
   - Searchable use cases and examples by team, role, or scenario.
   - Governance notes, risks, or implementation considerations.
   - Source notes listing the sources or assumptions used.
5. Create the dashboard as standalone HTML/CSS/JavaScript rather than raw React unless the environment explicitly supports React build output.
6. Preserve a clean professional design spirit:
   - Clean card-based layout.
   - Interactive concept selection.
   - Search/filter for use cases where useful.
   - Professional, clear tone with plain-language explanations, analogies, practical examples, and clear distinctions between concepts, benefits, limitations, and governance.
7. Use this content schema when adapting the original code:

```js
const concepts = [
  {
    key: 'short-key',
    label: 'Concept name',
    plain: 'One-sentence plain-language definition.',
    analogy: 'Simple analogy.',
    useWhen: 'When to use this concept or approach.',
    examples: ['Example 1', 'Example 2', 'Example 3'],
    limits: 'Watch-out or limitation.'
  }
];

const comparison = [
  ['Question', 'Concept A answer', 'Concept B answer', 'Concept C answer'],
  ['Primary purpose', '...', '...', '...'],
  ['Best for', '...', '...', '...'],
  ['Context model', '...', '...', '...'],
  ['Example', '...', '...', '...'],
  ['Governance need', '...', '...', '...']
];

const useCases = [
  { team: 'Team or role', task: 'Task or scenario', choose: 'Recommended option', value: 'Business value' }
];

const decisionTree = [
  { q: 'Practical decision question?', a: 'Recommended answer.' }
];
```

Optional schema when the topic benefits from it:

```js
const withoutWith = [
  { area: 'Area', without: 'What happens without this approach.', with: 'What improves with it.', why: 'Why it matters.' }
];

const topicSections = [
  { title: 'Section title', cards: [{ heading: 'Card heading', body: 'Card body' }] }
];
```

8. If saving the dashboard, create an `.html` file with a descriptive filename such as `<topic>-explainer-dashboard.html`.
9. If a tool fails or returns empty, say so plainly. Do not fabricate retrieved content, file URLs, or source notes.

## Output format
Return a concise confirmation with:
- The dashboard title.
- Where it was created or how it was delivered.
- Any assumptions or missing sources, if relevant.

When presenting the dashboard content inline, provide only the final HTML or a short preview plus the saved file link, depending on the user's request.
References
- agentskills.io specification
The specification that SharePoint AI skills follow for installation and discovery.
Discuss this skill
Ask a question, share how you used it, or suggest an improvement with the community.
Open GitHub Discussions