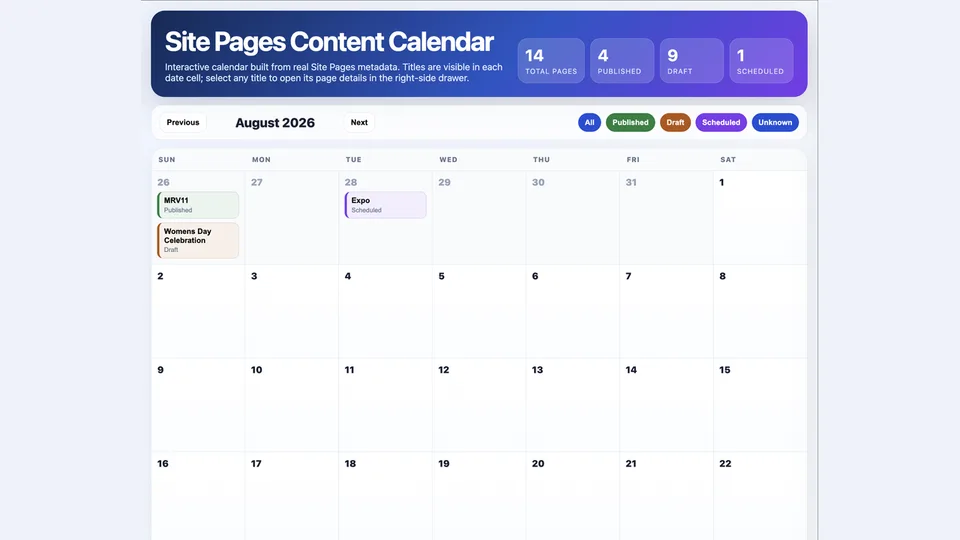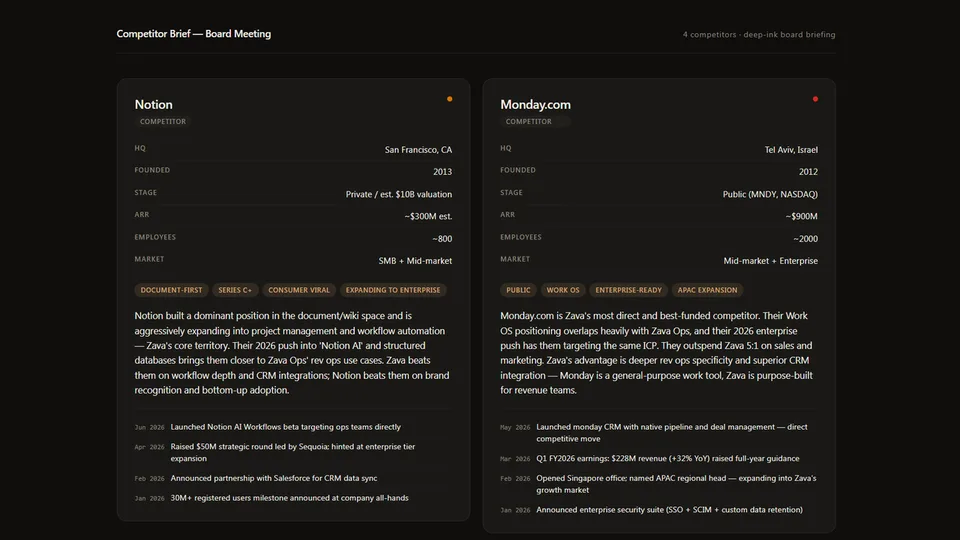
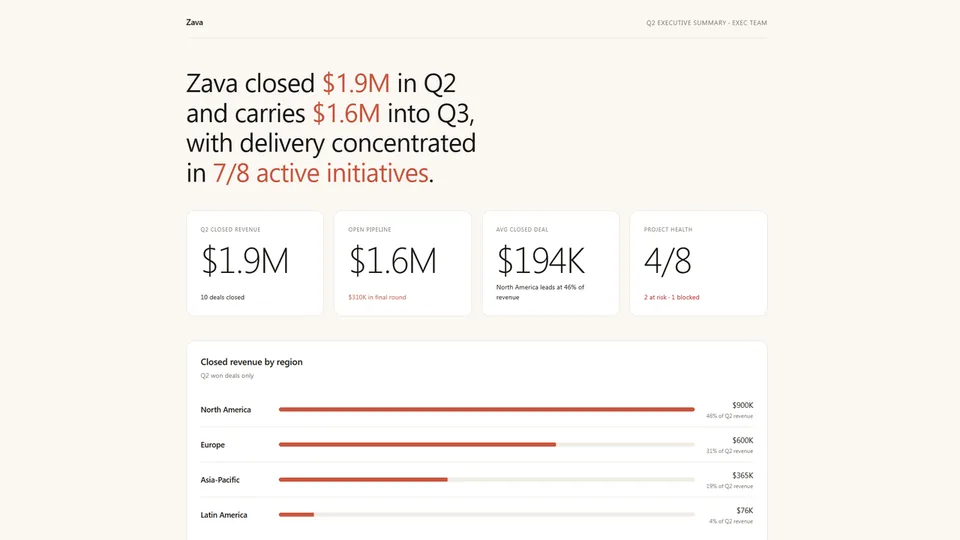
Generates a polished, self-contained HTML executive report by interviewing the user or parsing their data, constructing and validating a JSON document, then rendering it into a sandbox-safe HTML file using a component library. The JSON is the authoritative source of truth; the HTML is fully determined by it.
Supports three narrative intent models (Achievement, Problem, Status) and seven layout components: KPI cards, trend chart, bar breakdown, comparison panel, status grid, data table, and narrative highlights. Four visual palette options. No external dependencies — output runs inside a SharePoint sandboxed iframe.
Generates a polished, self-contained HTML executive report or dashboard from any data source — SharePoint lists, CSV exports, or a verbal description. Interviews the user, constructs a validated JSON document, then renders it into a single sandbox-safe HTML file with no external dependencies.
What you get
- A complete, self-contained HTML executive report with a chosen narrative structure: Achievement, Problem, or Status
- A component library covering KPI cards, trend charts, bar breakdowns, comparison panels, status grids, data tables, and narrative highlights
- Four visual palette options: warm paper (cream/terra-cotta), deep ink (dark/gold), clean white (white/green), and slate (gray/blue)
- A sandbox-safe file with all JavaScript inline — no CDN links, no external dependencies, works inside a SharePoint iframe
When to use
Ask Copilot:
- "build an exec report" / "create a one-pager" / "make a status dashboard"
- "business review for Q2" / "project summary page" / "generate a visual report"
- "here's my SharePoint list data, build a report" / "summarize this CSV into a report"
SharePoint Skill
| Solution | Author(s) |
|---|---|
| exec-report | Zach Rosenfield | GitHub | LinkedIn |
Version history
| Version | Date | Comments |
|---|---|---|
| 1.0 | May 2026 | Initial Release |
Disclaimer
THIS CODE IS PROVIDED AS IS WITHOUT WARRANTY OF ANY KIND, EITHER EXPRESS OR IMPLIED, INCLUDING ANY IMPLIED WARRANTIES OF FITNESS FOR A PARTICULAR PURPOSE, MERCHANTABILITY, OR NON-INFRINGEMENT.
Package
Ready to install
The ZIP contains only the upload-ready inner skill folder.
View SKILL.md
---
name: exec-report
description: >
  Generates a polished, self-contained HTML executive report or dashboard from any data
  source — SharePoint lists, CSV exports, or a user description. Use when asked to build
  an exec report, one-pager, summary page, status dashboard, project summary, business
  review, or any single-page visual summary of data. Interviews the user if data is
  incomplete, constructs a validated JSON document block by block, then renders it into a
  single sandbox-safe HTML file using the component library. No external dependencies —
  output runs inside a SharePoint sandboxed iframe.
metadata:
  author: zrosenfield
---

# Exec Report

Generates a complete, self-contained HTML report by (1) interviewing the user or parsing their data, (2) constructing and validating a JSON document, then (3) rendering that JSON into HTML using `assets/report-template.html`. The JSON is the authoritative source of truth; the HTML is fully determined by it.

---

## Step 1: Determine the Data Source

Check what the user has already provided before asking anything:

- **SharePoint lists**: Call `list_items` on the relevant lists. Read all needed columns before proceeding.
- **CSV or table pasted in chat**: Parse all rows. Do not ask for data you already have.
- **Verbal description only**: Proceed to Step 2.

---

## Step 2: Interview the User

If the data or intent is not fully clear, ask these questions in a single message — not one at a time:

1. **Topic**: What is this report about? (e.g., "Q2 pipeline health," "IT project status," "department spend overview")
2. **Audience**: Who is reading it? Exec team, department head, all-hands? This determines detail level.
3. **Narrative intent**: What is the *shape* of the story? Pick the closest match:
   - **Achievement** — "we hit a goal, here's how" (lead with the win: kpi-row + trend dominate)
   - **Problem** — "something needs attention, here's what" (lead with urgency: status-grid or table comes first)
   - **Status** — "here's where everything stands" (balanced overview: status-grid early, kpi-row supporting)
4. **Headline message**: What should the reader walk away knowing? This becomes the hero sentence — one sentence.
5. **Sections wanted**: Any specific sections — comparison to prior period, breakdown by category, status of open items, narrative highlights?
6. **Palette**: Warm paper (cream/terra-cotta), deep ink (dark/gold), clean white (white/green), or slate (gray/blue)? Default to warm paper if no preference.

If the user's prompt already signals narrative intent (e.g., "the headline is the gap," "lead with urgency," "show the wins"), skip question 3 — you already have the answer.

Confirm your understanding before building the JSON.

---

## Step 3: Choose Components and Narrative Order

The component sequence IS the story. Read `references/components.md` for the full component catalog, props schemas, and HTML patterns.

**Always true:**
- Open with `hero` — sets the company, label, and hero sentence.
- Close with `highlights` — narrative "so what" belongs last.
- Maximum one `trend`, one `table`, and one `highlights` per report.
- Keep total block count to 4–8.

**Narrative intent drives the block order:**

| Intent | Typical sequence | Hero sentence shape |
|---|---|---|
| **Achievement** | hero → kpi-row → trend → bar-list → compare → status-grid → highlights | "We closed $X, up Y% from last quarter." |
| **Problem** | hero → status-grid → compare → table → bar-list → highlights | "We enter Q3 with X open roles and a gap in Y." |
| **Status** | hero → status-grid → kpi-row → compare → bar-list → highlights | "Here's where all six workstreams stand heading into Q3." |

The hero sentence signals intent to the reader. Achievement heroes lead with a number and a direction. Problem heroes lead with a situation. Status heroes lead with a scope statement.

**Component selection guide:**

| Data shape | Component |
|---|---|
| 2–4 headline numbers worth celebrating or tracking | `kpi-row` |
| Values over time (3+ periods) | `trend` |
| Category breakdown with relative sizes | `bar-list` |
| Structured numeric comparison (QoQ, YoY, plan vs. actual) | `compare` |
| Detailed row data (5+ items with 3+ fields) | `table` |
| Health or urgency status of multiple items | `status-grid` |
| Narrative insights: bright spots, risks, actions | `highlights` |

**Hard rules:**
- Never put a headline number in prose when `kpi-row` can show it larger.
- Never use `table` for 2–4 numbers — use `kpi-row`.
- `kpi-row` is not mandatory — omit it when the story is problem- or urgency-forward and metrics are supporting context, not the lead.

---

## Step 4: Build and Validate the JSON Document

Construct the JSON object. Top-level structure:

**`report` object** (document metadata):

| Field | Required | Description |
|---|---|---|
| `palette` | yes | `warm-paper`, `deep-ink`, `clean-white`, or `slate` |
| `footer_l` | no | Left footer text, e.g. `"Generated May 28, 2026"` |
| `footer_r` | no | Right footer text, e.g. `"47 deals analyzed"` |

**`blocks` array** — ordered list of content blocks. Each block: `type` string + `props` object. See `references/components.md` for every component's full props schema.

### Validation Checklist

Run every check before rendering. Fix any failure before proceeding.

**Document level:**
- [ ] `report.palette` is one of: `warm-paper`, `deep-ink`, `clean-white`, `slate`
- [ ] `blocks` array has at least one entry
- [ ] First block `type` is `hero`
- [ ] Last block `type` is `highlights`
- [ ] Block order reflects the declared narrative intent (achievement / problem / status)

**Per block:**
- [ ] `type` is one of: `hero`, `kpi-row`, `trend`, `bar-list`, `compare`, `table`, `status-grid`, `highlights`
- [ ] All required props are present (see components.md)
- [ ] Numeric values are numbers, not strings with embedded units
- [ ] No block exceeds its item count limits (see components.md limits table)

**Data integrity:**
- [ ] `kpi-row` items count is 2–4
- [ ] `bar-list` shares: largest item = 1.0, all others ≤ 1.0
- [ ] `trend` data and labels arrays have the same length (3–12)
- [ ] `trend` prior_data (if present) same length as data
- [ ] `compare` rows have `dir` set to `"up"` or `"down"` on every row
- [ ] `table` headers count matches every row's cell count
- [ ] `highlights` items count is 3–5

---

## Step 5: Render the HTML

1. Read `assets/report-template.html`.
2. Replace `{{REPORT_TITLE}}` in `<title>` with a concise page title (company + report label).
3. Replace `{{PALETTE_CLASS}}` on `<body>` with `palette-` + the palette name (e.g. `palette-warm-paper`).
4. Generate the `hero` block HTML (`.rpt-header` + `.hero`) and replace `{{HERO}}`.
5. Generate all remaining blocks in order and replace `{{BLOCKS}}`.
6. Replace `{{FOOTER_L}}` and `{{FOOTER_R}}` with footer text (or empty strings).
7. Generate the `{{INLINE_SCRIPT}}` content. Include:
   - Segment bar fill-in code (if any `bar-list` blocks are present)
   - Trend tooltip JS with embedded `TREND_DATA` array (if a `trend` block is present)
   - See the template's script comment block for the exact code patterns to use.
8. Deliver the complete file as the response. No prose outside the file.

If the site context specifies a folder for report output, save the file there after delivering it.

---

## Hard Constraints

- No external URLs, CDN links, or web fonts in the output HTML.
- No `<script src>` tags. All JavaScript must be inline.
- All data values must be pre-rendered into the HTML — the page must be fully correct with JavaScript disabled. JS adds animations and tooltips but must never be required for correctness.
- Do not generate Python, PowerShell, or any other scripts — output is always the HTML file.
- Do not render until the validation checklist passes.
- Follow the no-Person-column-type rule for any accompanying SharePoint schema: use text columns only.
References
- agentskills.io specification
The specification that SharePoint AI skills follow for installation and discovery.
Discuss this skill
Ask a question, share how you used it, or suggest an improvement with the community.
Open GitHub Discussions