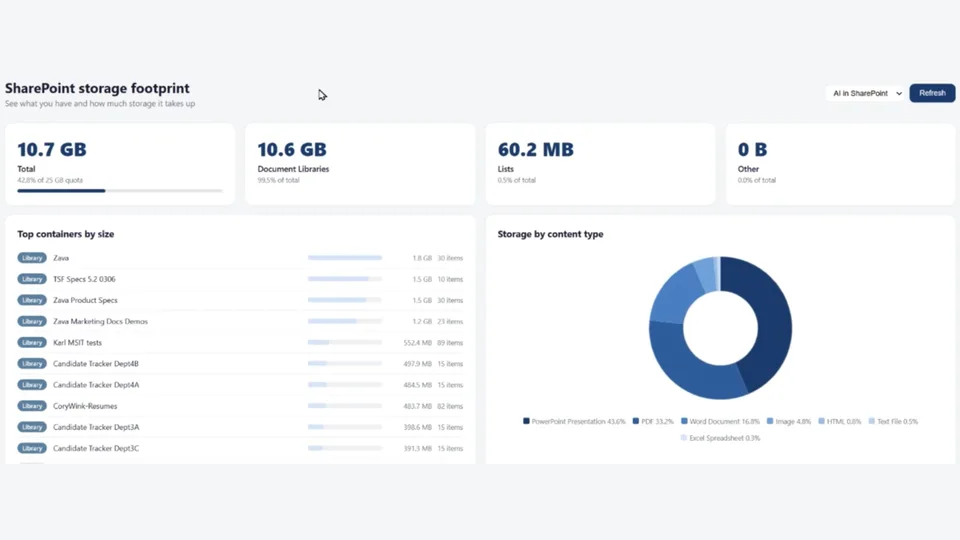
Generates an interactive HTML site map showing storage breakdown and hot/cold activity heatmap across all document libraries, lists, and site pages on a SharePoint site.
Includes a site-wide summary with stacked horizontal bars showing hot/warm/cool/cold activity tiers, and per-library click-through drill-downs with file count, total size, file type breakdown, and activity heatmap. Saves the file as {FirstName}-Site-Storage-Heatmap.html and navigates the user directly to it.
Generates an interactive HTML site map showing storage breakdown and hot/cold activity heatmap across all document libraries, lists, and site pages on a SharePoint site.
What you get
- A site-wide summary with stacked horizontal bars showing hot/warm/cool/cold activity tiers across document libraries, lists, and site pages
- Per-library click-through drill-downs showing file count, total size, file type breakdown, and activity heatmap
- Storage breakdown by file type with percentage bars
- The file saved as
{FirstName}-Site-Storage-Heatmap.htmlin astorage heatmapfolder in the site's document library - Automatic navigation to the saved file on completion
Open the HTML in a browser tab, not as a SharePoint preview. SharePoint strips inline JavaScript from in-browser file previews, so the click-through drill-downs and modal only work after you download the file (or open it in a new tab from the document library).
When to use
Ask Copilot:
- "site storage heatmap" / "storage heatmap for this site"
- "show me what's hot and cold on this site"
- "site map with storage sizes" / "site map heatmap"
- "which libraries are taking the most space" / "where is the storage going"
- "what content is stale on this site"
Best on a site you own or admin — the skill enumerates every library, list, and page library, so it needs broad read access to give a complete picture.
SharePoint Skill
| Solution | Author(s) |
|---|---|
| site-storage-heatmap | Joe Komban (Microsoft) | GitHub | LinkedIn |
Version history
| Version | Date | Comments |
|---|---|---|
| 1.0 | May 2026 | Initial Release |
Disclaimer
THIS CODE IS PROVIDED AS IS WITHOUT WARRANTY OF ANY KIND, EITHER EXPRESS OR IMPLIED, INCLUDING ANY IMPLIED WARRANTIES OF FITNESS FOR A PARTICULAR PURPOSE, MERCHANTABILITY, OR NON-INFRINGEMENT.
Package
Ready to install
The ZIP contains only the upload-ready inner skill folder.
f307f9030ce08a0a1d85b55bc8882429fa4f6622dc2b3cc4a3ebd75cd1ff341fView SKILL.md
---
name: "site-storage-heatmap"
description: "Generates an interactive HTML site map showing storage breakdown and hot/cold activity heatmap across all document libraries, lists, and site pages. Includes site-wide summary stacked bars and per-library click-through drill-downs. Saves the file as {FirstName}-Site-Storage-Heatmap.html in the \"storage heatmap\" folder inside the site's document library, then navigates the user to it."
---
# Site Storage Heatmap

Generate an interactive HTML site map with storage sizes and hot/cold activity heatmaps for a SharePoint site, then navigate the user to the output.

## Steps

### 1. Get the Current User's First Name
- Call `get_user_info(query="@currentUser")` to resolve the current user.
- Extract the **first name** from the resolved display name (e.g., "Adam Harmetz" → "Adam").
- The output filename will be: `{FirstName}-Site-Storage-Heatmap.html`

### 2. Discover All Containers
- Call `discover_sharepoint_lists` with `filterType="all"` and `includeHidden=false` to get every list, library, and page library on the site.
- Categorize each container:
  - **Document Libraries**: templateType 101
  - **Lists**: templateType 100
  - **Site Pages**: templateType 119
  - **Calendar**: templateType 106
- Record each container's `id`, `title`, `itemCount`, and `serverRelativeUrl`.

### 3. Collect File-Level Data from Each Non-Empty Library
- For every document library (templateType 101) with itemCount > 0, call `list_items` with:
  - `viewFields: ["FileLeafRef", "File_x0020_Size", "File_x0020_Type", "Modified"]`
  - `itemType: "files"`, `recursive: true`, `rowLimit` set to the library's `itemCount`
- For Site Pages (templateType 119), also query with `viewFields: ["FileLeafRef", "Modified"]` to get page modification dates.
- Parallelize all independent list_items calls.

#### Large sites (≥ 100 libraries or any library with ≥ 5,000 items)

Naïvely parallelising every `list_items` call against a large site will hit throttling (HTTP 429) and balloon memory because every file row sits in the model state.

- **Batch the parallel fan-out** at no more than **~10 concurrent `list_items` calls**. After each batch, aggregate the results into the running totals via `execute_code` with `outputDataRef: true` so the raw rows are released from model state. Never hold all libraries' file rows in memory at once.
- **Per-library paging.** If a library reports `itemCount` > 5,000, fetch it in pages of 5,000 (the SharePoint list view threshold) rather than one giant `rowLimit`. Aggregate per-page into running totals — do not retain the per-page raw arrays after they are summed.
- **On 429 / throttling**: back off, retry the affected library once with a smaller `rowLimit`, and continue. If retry fails, record the library as `Partial data — throttled` and surface it explicitly in the HTML output (a yellow badge on that library card) so the consumer knows the totals are an undercount, not zero.
- **Progress reporting.** Every 10 libraries processed, post a short progress line (`Processed 30 of 142 libraries…`) so a multi-minute run doesn't look frozen.
- **Never silently drop a library.** Every container from Step 2 must appear in the final HTML output, even if its row is annotated `(no data)` or `(throttled)`.

### 4. Aggregate Per-Library Stats
For each library, compute:
- **Total size** (sum of `File_x0020_Size` in bytes)
- **File count**
- **File type breakdown**: group by `File_x0020_Type` → `{ ext: { count, size } }`
- **Recency buckets** based on `Modified` date relative to today:
  - **Hot**: modified ≤ `HOT_DAYS` ago (default **7**)
  - **Warm**: modified ≤ `WARM_DAYS` ago (default **30**)
  - **Cool**: modified ≤ `COOL_DAYS` ago (default **90**)
  - **Cold**: modified > `COOL_DAYS` ago
- Track both file count AND storage per recency bucket.

#### Configurable bucket thresholds

The `7 / 30 / 90` day defaults are conventional but not always right — a fast-moving project site may want `1 / 7 / 30`, a records archive may want `30 / 180 / 365`.

- Honour explicit overrides in the user's prompt. Examples that must work:
  - *"heatmap with hot=1 day, warm=7, cool=30"*
  - *"use 30/90/365 buckets"*
  - *"only consider files older than a year as cold"*
- Validate: `HOT_DAYS < WARM_DAYS < COOL_DAYS`, all positive integers. If the user gives invalid values, ask once for correction; do not silently re-order.
- Always **render the thresholds used in the HTML output** — a small legend line under the heatmap such as `Hot ≤ 7d · Warm ≤ 30d · Cool ≤ 90d · Cold > 90d` — so the consumer can tell at a glance what "hot" means in this report.

For lists (no file sizes), classify each list as hot/warm/cool/cold based on the list's `lastModified` date from the discovery response. Count list items per recency bucket.

### 5. Compute Site-Wide Rollup
Sum across ALL containers (libraries + lists + pages):
- Grand total items (files + list items + pages)
- Total storage (libraries only)
- Aggregate recency: total hot / warm / cool / cold counts
- Separate recency breakdowns for: Document Libraries, Lists, Site Pages

### 6. Generate the Interactive HTML
Build a self-contained HTML file with embedded CSS and JavaScript containing:

#### Root Banner
- Site name, total item count, container count, page count
- "Total Library Storage: X" badge

#### Site-Wide Heatmap Panel (below root, above branches)
- 3-column grid: one for Document Libraries, one for Lists, one for Site Pages
- Each column has a **stacked horizontal bar** (hot=red #E74856, warm=orange #FF8C00, cool=blue #50E6FF, cold=grey #A0AEC0) showing file/item counts per recency tier
- Below each bar: storage per tier (for libraries) or counts (for lists/pages)
- Bottom legend row: grand totals per tier across the entire site

#### 3-Column Site Map (below heatmap)
- **Column 1 (wider)**: Document Libraries — all libraries merged together (including expense libraries), sorted by total size descending. Each leaf card shows: name, size badge, file count badge. Clickable.
- **Column 2**: Lists — each list with item count badge. Not clickable.
- **Column 3**: Site Pages — each page name. Not clickable.
- Empty containers grayed out.

#### Click-Through Modal (JavaScript)
When a library leaf is clicked, show a modal overlay with:
- **Summary cards**: File count, Total size, File type count
- **Activity Heatmap**: 4 horizontal bars (hot/warm/cool/cold) showing file counts + storage per tier
- **Storage by File Type**: horizontal bars per extension showing % of total, file count, and size
- Close on Escape, click outside, or ✕ button

#### Styling
- Use Segoe UI font, #f5f5f5 background
- Branch headers: blue gradient for doc libs, green for lists, purple for pages
- Responsive grid that stacks on mobile
- Hover effects on clickable leaves (translateX + shadow)
- Modal with backdrop blur

### 7. Save the HTML File
- Save as `{FirstName}-Site-Storage-Heatmap.html`
- Target location: the site's document library, inside a folder called **"storage heatmap"**
  - Use `create_text_file` with `relativeFolderPath="storage heatmap"`
  - If the folder doesn't exist, create it first with `create_folder`

### 8. Navigate the User
- After saving, call `navigate_to_url` to take the user to the document library where the file was saved.
- Provide the direct file URL so the user can open it.
- Remind the user: **"Download and open in your browser for full interactivity — SharePoint strips JavaScript from inline HTML previews."**

## Example

**User**: "Generate a storage heatmap for this site"

**Result**: File saved as `Adam-Site-Storage-Heatmap.html` in the "storage heatmap" folder, user navigated to the library, with a note to download for JS interactivity.

## Constraints
- Always get the current user's first name — never hardcode.
- Always get the current date via `get_datetime_info` before computing recency buckets — never assume today's date.
- Parallelize list_items calls for all non-empty libraries to minimize latency. For large sites, follow the batching/throttling rules in **Step 3 → Large sites** — never fan out unbounded.
- Use `execute_code` with `outputDataRef: true` for all large intermediate data so raw rows are released from model state after aggregation.
- Keep the HTML fully self-contained (no external dependencies).
- File type colors: use a rotating palette of Fluent-style colors.
- Recency colors are fixed: hot=#E74856, warm=#FF8C00, cool=#50E6FF, cold=#A0AEC0.
- Recency thresholds are configurable per run (see **Step 4 → Configurable bucket thresholds**) but **must be rendered in the HTML** so the report is self-explanatory.
- Every container discovered in Step 2 must appear in the final HTML, including throttled or empty ones — never silently drop.
References
- agentskills.io specification
The specification that SharePoint AI skills follow for installation and discovery.
Discuss this skill
Ask a question, share how you used it, or suggest an improvement with the community.
Open GitHub Discussions